

Question: PLEASE HELP ME Develop a 3 standard deviation ( 99.73% confidence) p-chart and graph the samples Upper Control Lint (UCL Up ) =0.1223 (round your
PLEASE HELP ME 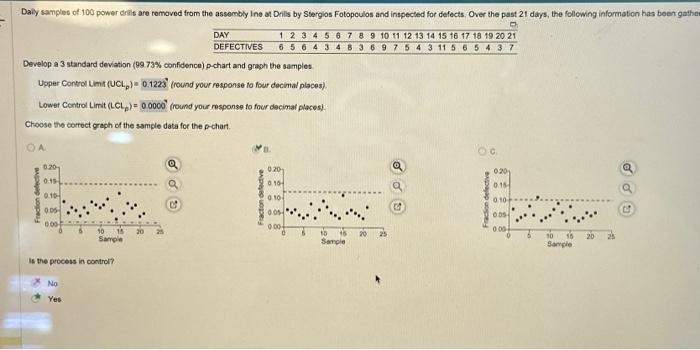
Develop a 3 standard deviation ( 99.73% confidence) p-chart and graph the samples Upper Control Lint (UCL Up ) =0.1223 (round your response fo four decintal places). Lower Control Limit (LCLp)=0.0000 (round your response fo four decimal places). Choose the correct graph of the sample data for the p-chart. \&. Is the process in coontrol
Step by Step Solution
There are 3 Steps involved in it
1 Expert Approved Answer
Step: 1 Unlock

Question Has Been Solved by an Expert!
Get step-by-step solutions from verified subject matter experts
Step: 2 Unlock
Step: 3 Unlock