

Question: PLEASE HELP ME!!! Directions: A census report is summarized in the table below. Using technology such as GeoGebra or a graphing calculator, perform a quadratic
PLEASE HELP ME!!!
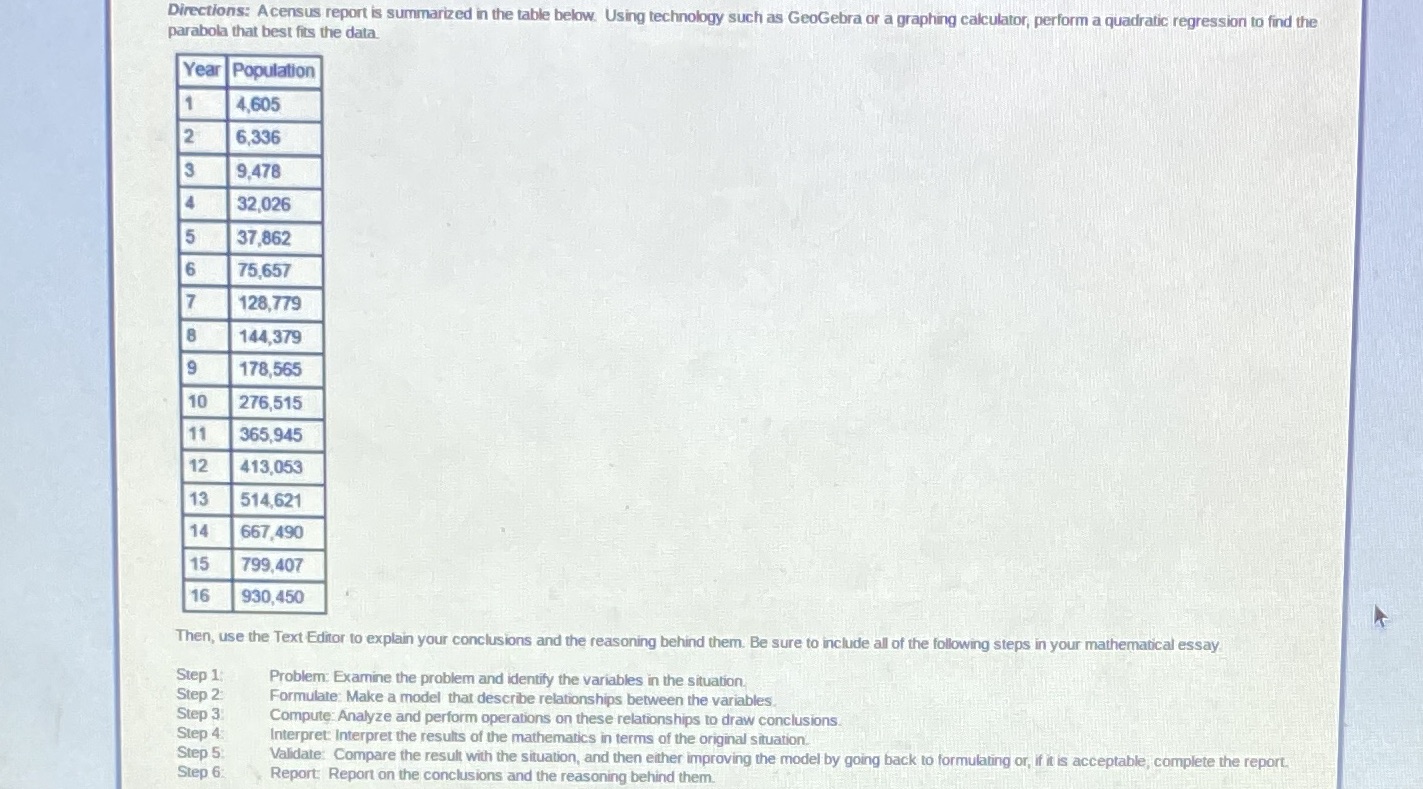
Directions: A census report is summarized in the table below. Using technology such as GeoGebra or a graphing calculator, perform a quadratic regression to find the parabola that best fits the data. Year Population 4.605 2 6,336 3 9,478 32,026 5 37,862 6 75,657 7 128,779 8 144,379 9 178,565 10 276,515 1 365,945 12 413,053 13 514,621 14 667,490 15 799,407 16 930,450 Then, use the Text Editor to explain your conclusions and the reasoning behind them. Be sure to include all of the following steps in your mathematical essay Step 1: Problem: Examine the problem and identify the variables in the situation. Step 2: Formulate: Make a model that describe relationships between the variables Step 3 Compute Analyze and perform operations on these relationships to draw conclusions Step 4 Interpret: Interpret the results of the mathematics in terms of the original situation. Step 5: Validate: Compare the result with the situation, and then either improving the model by going back to formulating or, if it is acceptable, complete the report. Step 6 Report: Report on the conclusions and the reasoning behind them
Step by Step Solution
There are 3 Steps involved in it

Get step-by-step solutions from verified subject matter experts