

Question: Please help me draw a graph similar to the one below to be able to solve part c Thank you Suppose we are analyzing the
Please help me draw a graph similar to the one below to be able to solve part c Thank you
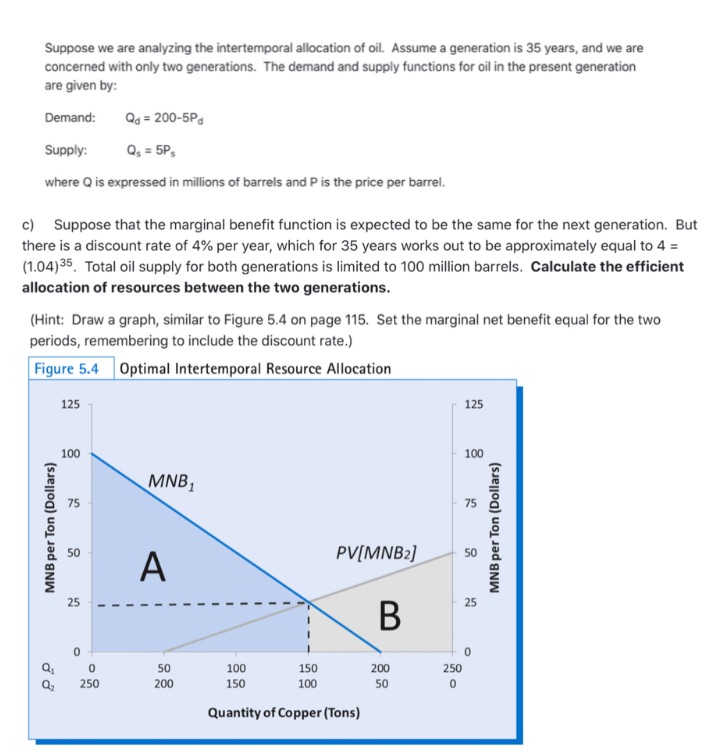
Suppose we are analyzing the intertemporal allocation of oil. Assume a generation is 35 years, and we are concerned with only two generations. The demand and supply functions for oil in the present generation are given by: Demand: Qd = 200-5Pa Supply: Qs = 5Ps where Q is expressed in millions of barrels and P is the price per barrel. c) Suppose that the marginal benefit function is expected to be the same for the next generation. But there is a discount rate of 4% per year, which for 35 years works out to be approximately equal to 4 = (1.04)35. Total oil supply for both generations is limited to 100 million barrels. Calculate the efficient allocation of resources between the two generations. (Hint: Draw a graph, similar to Figure 5.4 on page 115. Set the marginal net benefit equal for the two periods, remembering to include the discount rate.) Figure 5.4 Optimal Intertemporal Resource Allocation 125 125 100 100 MNB 1 75 75 MNB per Ton (Dollars) MNB per Ton (Dollars) 50 PV[MNB2] 50 A 25 25 B Q1 50 100 150 200 250 250 200 150 100 50 Quantity of Copper (Tons)
Step by Step Solution
There are 3 Steps involved in it

Get step-by-step solutions from verified subject matter experts