

Question: Please help me draw the C-Chart on Excel or by hand (your preference). Thanks! Problem 5. Given the following data for the number of defects
Please help me draw the C-Chart on Excel or by hand (your preference). Thanks!
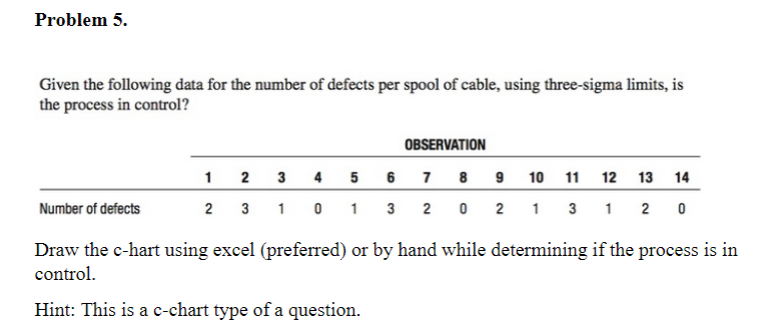
Problem 5. Given the following data for the number of defects per spool of cable, using three-sigma limits, is the process in control? OBSERVATION 7 8 1 2 3 4 5 6 9 10 11 12 13 14 Number of defects 2 3 1 0 1 3 2 0 2 1 3 1 2 0 Draw the c-hart using excel (preferred) or by hand while determining if the process is in control. Hint: This is a c-chart type of aStep by Step Solution
There are 3 Steps involved in it
1 Expert Approved Answer
Step: 1 Unlock

Question Has Been Solved by an Expert!
Get step-by-step solutions from verified subject matter experts
Step: 2 Unlock
Step: 3 Unlock