

Question: PLEASE HELP ME. EVERYTHING NEEDED FOR THIS QUESTION IS INCLUDED IN THE LINK AND ATTACHMENT https://drive.google.com/file/d/1WX57KQp37hex7dijRuX0b7MU19OCmnXu/view?usp=sharing 1A) Above is the link to the file containing
PLEASE HELP ME. EVERYTHING NEEDED FOR THIS QUESTION IS INCLUDED IN THE LINK AND ATTACHMENT
https://drive.google.com/file/d/1WX57KQp37hex7dijRuX0b7MU19OCmnXu/view?usp=sharing
1A) Above is the link to the file containing the means of random samples of various sizes (n = 10, 20 and 30) from the population of female mosquito fish (randomsamplemeans.xls)
In Excel, for each of the three sample sizes, draw a graph showing the means and 95% CIs. Also, draw a line on the graph showing the population mean (? = 34.29 mm). Set the Y axis scale so that it ranges from 25 to 45 units on all three graphs, give the axes a label. That will make them easier to compare visually.
Your graphs should look like the plot in the attachment (except that you have different sample means and a different total number of samples to plot):
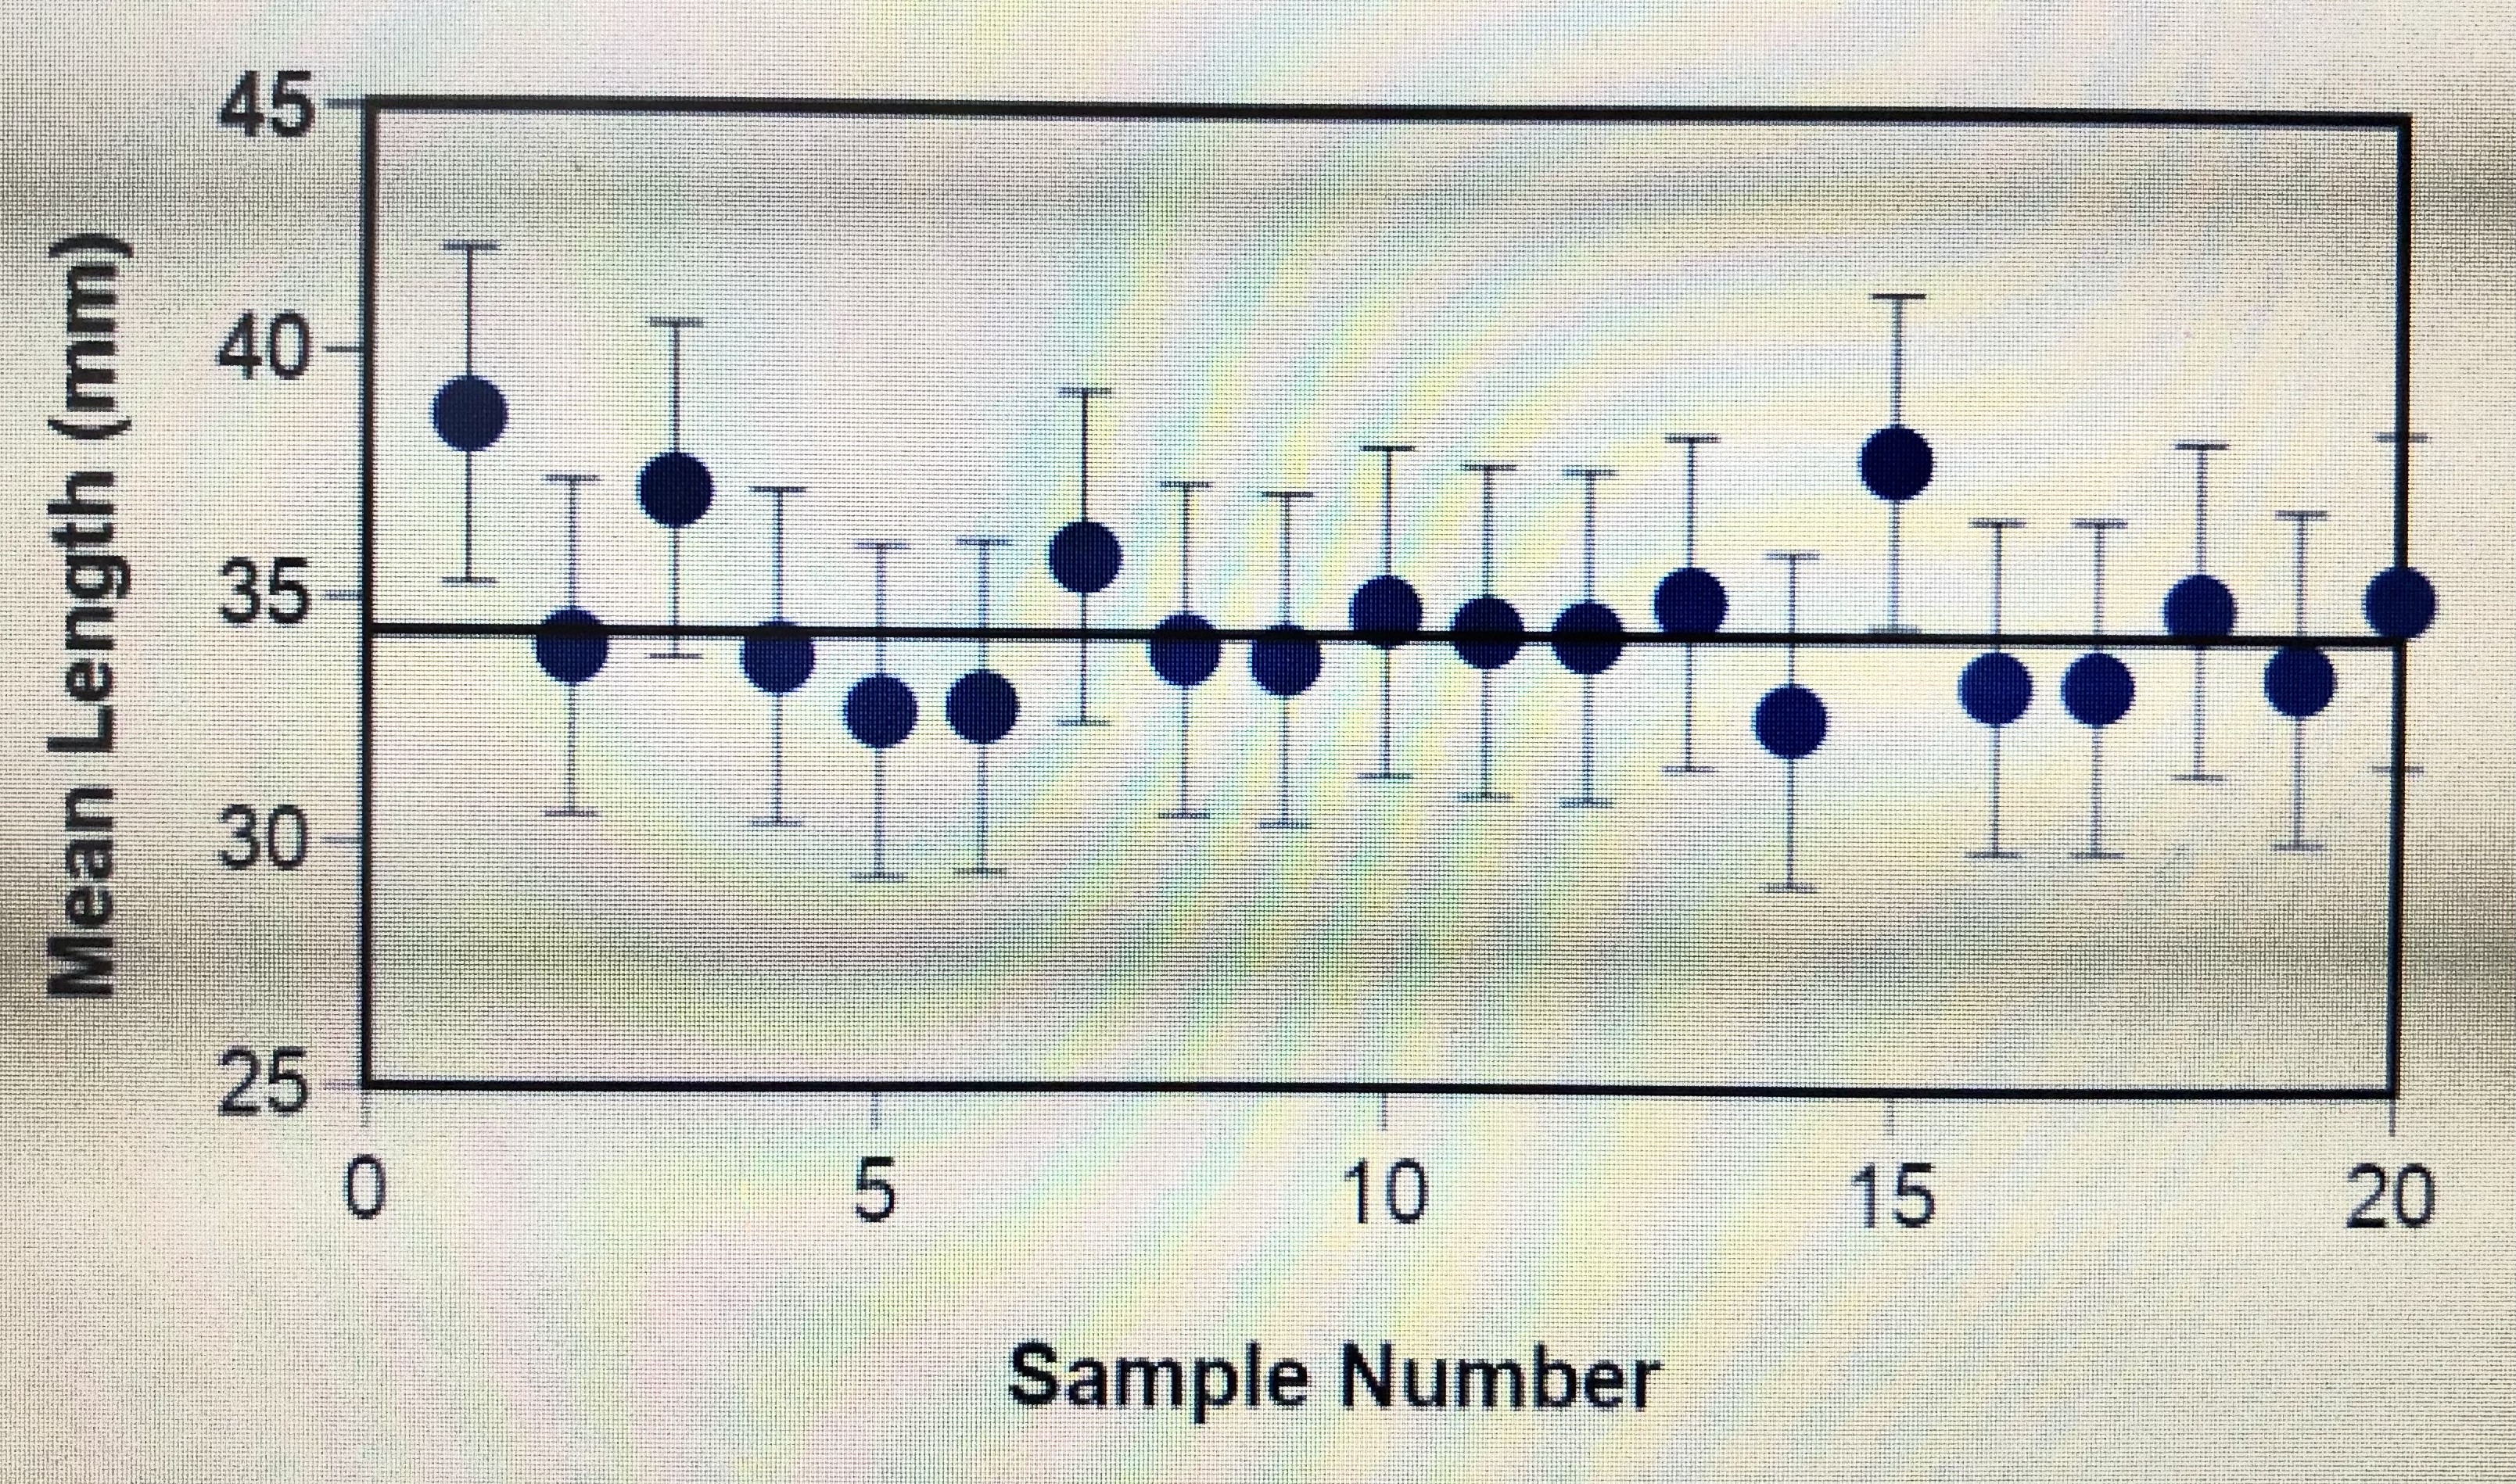
45 40 Mean Length (mm) 35 30 25 O 5 10 15 20 Sample Number
Step by Step Solution
There are 3 Steps involved in it

Get step-by-step solutions from verified subject matter experts