

Question: Please help me.. Exercise 13-43 Multiple-Year Trend Reports The controller of Ephraim, Inc. has computed quality costs as a percentage of sales for the past
 Please help me..
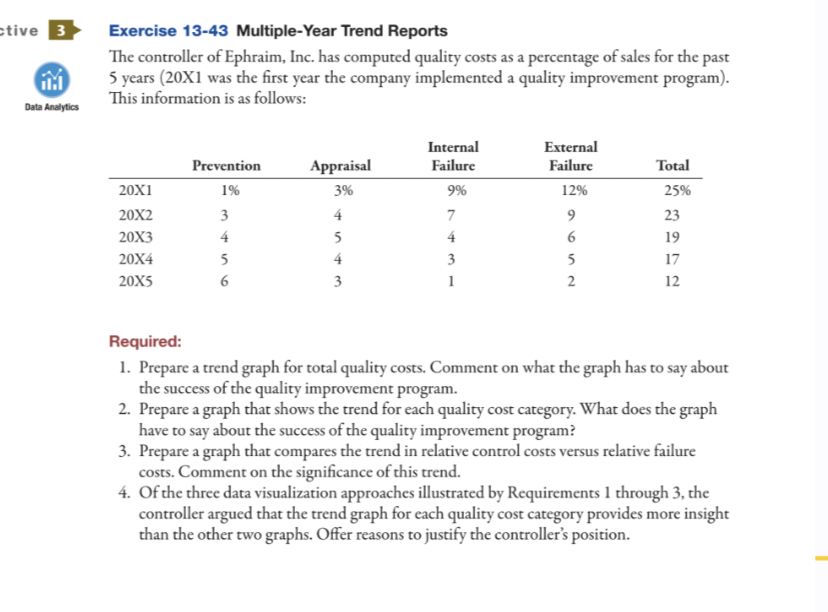
Exercise 13-43 Multiple-Year Trend Reports The controller of Ephraim, Inc. has computed quality costs as a percentage of sales for the past 5 years (20X1 was the first year the company implemented a quality improvement program). This information is as follows: Required: 1. Prepare a trend graph for total quality costs. Comment on what the graph has to say about the success of the quality improvement program. 2. Prepare a graph that shows the trend for each quality cost category. What does the graph have to say about the success of the quality improvement program? 3. Prepare a graph that compares the trend in relative control costs versus relative failure costs. Comment on the significance of this trend. 4. Of the three data visualization approaches illustrated by Requirements 1 through 3 , the controller argued that the trend graph for each quality cost category provides more insight than the other two graphs. Offer reasons to justify the controller's position
Step by Step Solution
There are 3 Steps involved in it

Get step-by-step solutions from verified subject matter experts