

Question: Please help me explain this table. Please indicate in the explaination what is on the table. Please also explain why the experimental group perform better
Please help me explain this table. Please indicate in the explaination what is on the table. Please also explain why the experimental group perform better than the control group
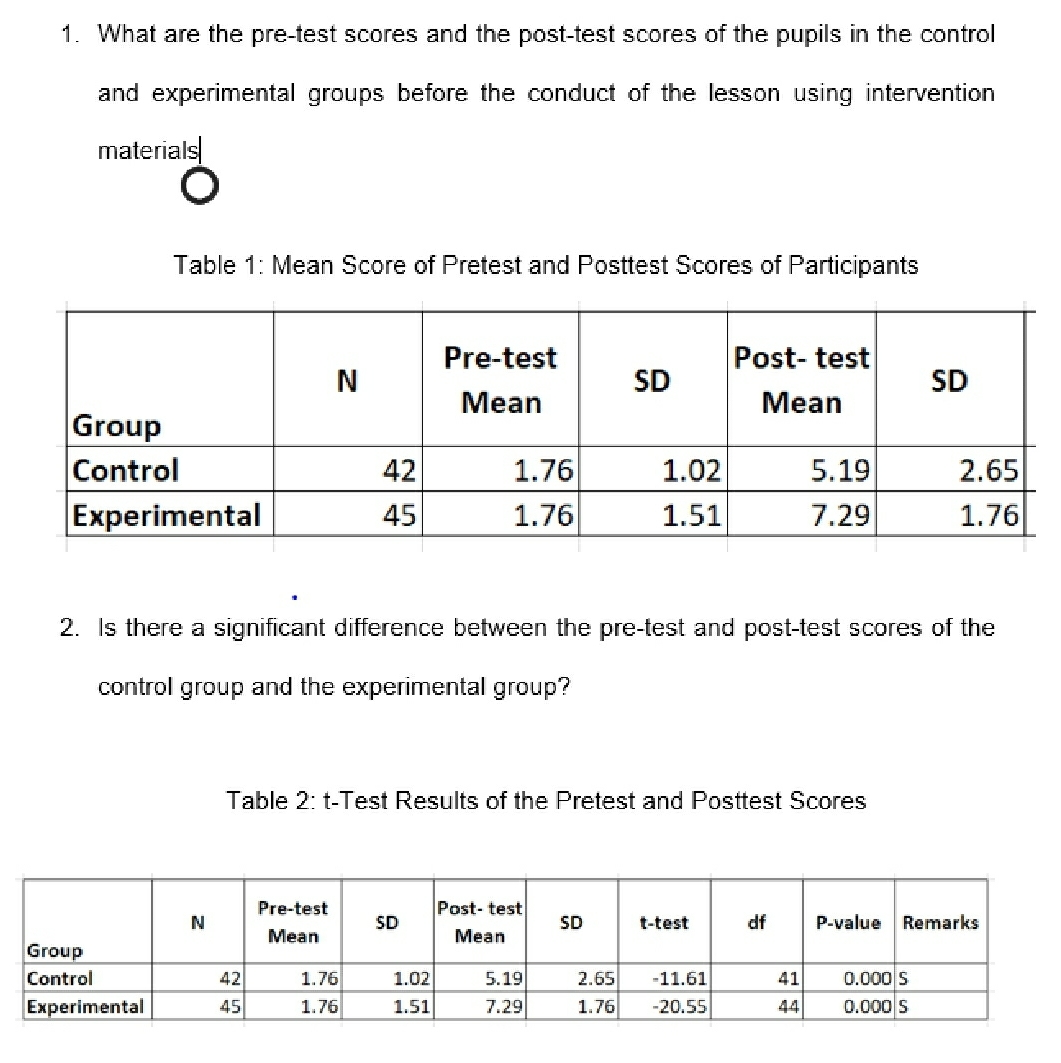
1. What are the pre-test scores and the post-test scores of the pupils in the control and experimental groups before the conduct of the lesson using intervention materials O Table 1: Mean Score of Pretest and Posttest Scores of Participants Pre-test Post- test N SD SD Mean Mean Group Control 42 1.76 1.02 5.19 2.65 Experimental 45 1.76 1.51 7.29 1.76 2. Is there a significant difference between the pre-test and post-test scores of the control group and the experimental group? Table 2: t-Test Results of the Pretest and Posttest Scores Pre-test Post- test N SD SD t-test df P-value Remarks Mean Mean Group Control 42 1.76 1.02 5.19 2.65 -11.61 41 0.000 S Experimental 45 1.76 1.51 7.29 1.76 -20.55 44 0.000 S
Step by Step Solution
There are 3 Steps involved in it

Get step-by-step solutions from verified subject matter experts