

Question: Please help me figure out. I know this can be uploaded to statcrunch but I am not sure what test to run. Please give specifics
Please help me figure out. I know this can be uploaded to statcrunch but I am not sure what test to run. Please give specifics on how to enter data into statcrunch
1
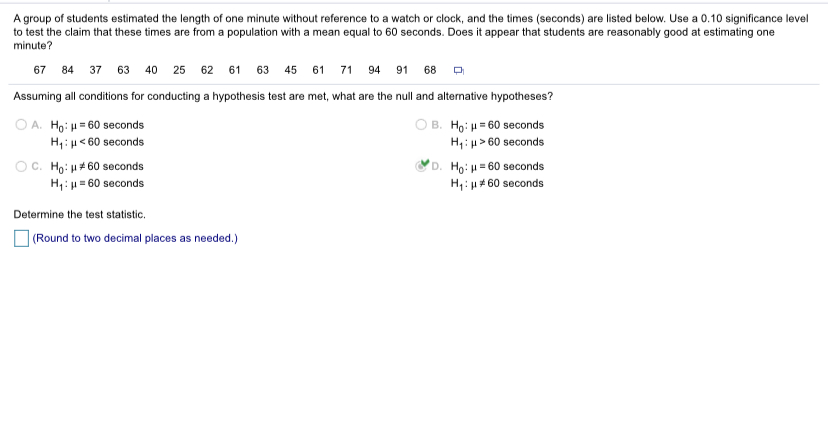
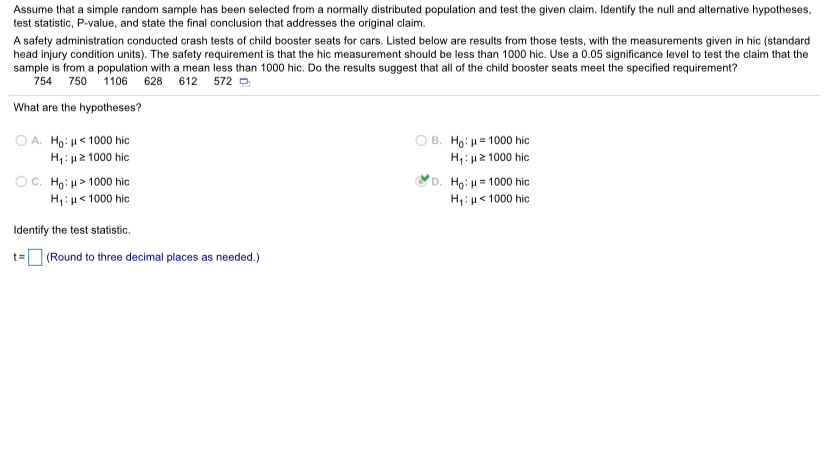
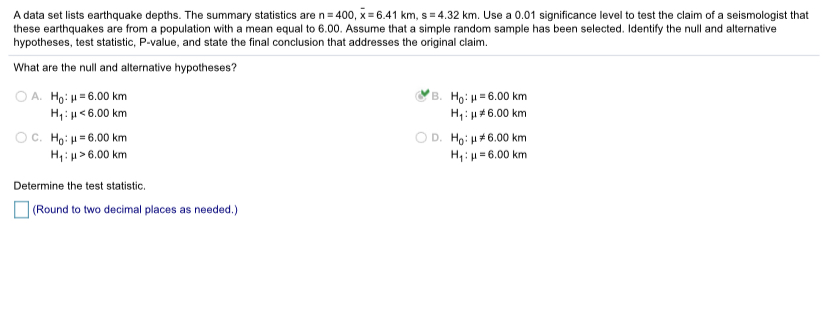
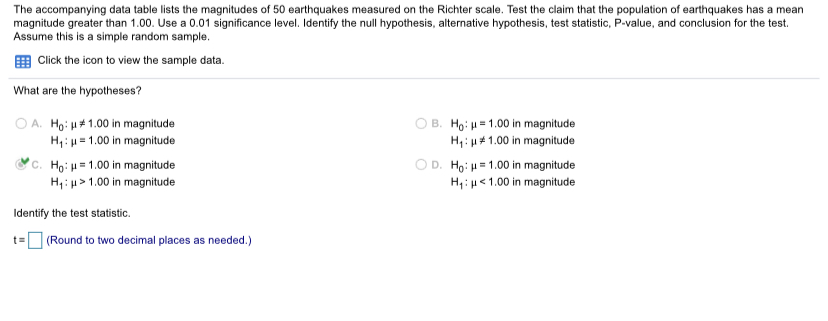
A group of students estimated the length of one minute without reference to a watch or clock, and the times (seconds) are listed below. Use a 0.10 significance level to test the claim that these times are from a population with a mean equal to 60 seconds. Does it appear that students are reasonably good at estimating one minute? 67 84 37 63 40 25 62 61 63 45 61 71 94 91 68 Assuming all conditions for conducting a hypothesis test are met, what are the null and alternative hypotheses? O A. Hip= 60 seconds O B. Hip = 60 seconds Hy: u 60 seconds O C. Ho: p # 60 seconds D. Ho: | = 60 seconds Hy: u = 60 seconds Hy: p # 60 seconds Determine the test statistic. (Round to two decimal places as needed.)Assume that a simple random sample has been selected from a normally distributed population and test the given claim. Identify the null and alternative hypotheses, test statistic, P-value, and state the final conclusion that addresses the original claim. A safety administration conducted crash tests of child booster seats for cars. Listed below are results from those tests, with the measurements given in hic (standard head injury condition units). The safety requirement is that the hic measurement should be less than 1000 hic. Use a 0.05 significance level to test the claim that the sample is from a population with a mean less than 1000 hic. Do the results suggest that all of the child booster seats meet the specified requirement? 754 750 1106 628 612 572 What are the hypotheses? O A. Ho: | 1000 hic D. Hill = 1000 hic Hy: p 6.00 km Hy : u = 6.00 km Determine the test statistic. (Round to two decimal places as needed.)The accompanying data table lists the magnitudes of 50 earthquakes measured on the Richter scale. Test the claim that the population of earthquakes has a mean magnitude greater than 1.00. Use a 0.01 significance level. Identify the null hypothesis, alternative hypothesis, test statistic, P-value, and conclusion for the test. Assume this is a simple random sample. Click the icon to view the sample data. What are the hypotheses? O A. Ho: p # 1.00 in magnitude O B. Ho: p = 1.00 in magnitude Hy: p = 1.00 in magnitude Hy: p # 1.00 in magnitude C. Hip= 1.00 in magnitude O D. Hip = 1.00 in magnitude Hy: pl > 1.00 in magnitude Hy:p
Step by Step Solution
There are 3 Steps involved in it

Get step-by-step solutions from verified subject matter experts