

Question: Please help me fill in these charts. Riverside Sweets, a retail candy store chain, reported the following figures: RIVERSIDE SWEETS Additional financial information: a .
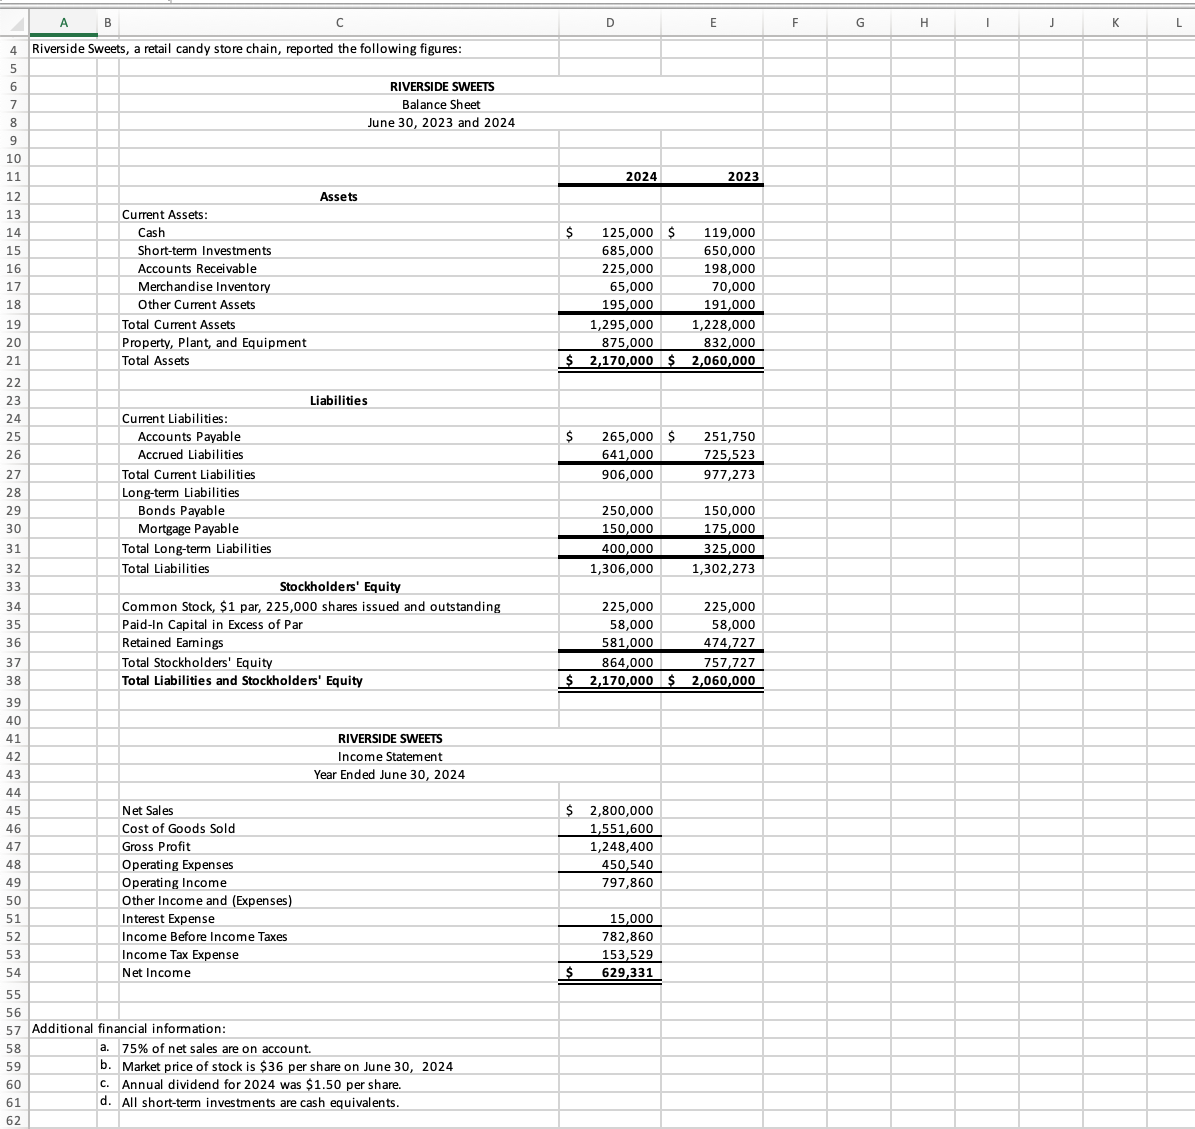
Please help me fill in these charts. Riverside Sweets, a retail candy store chain, reported the following figures:
RIVERSIDE SWEETS
Additional financial information:
a of net sales are on account.
b Market price of stock is $ per share on June
c Annual dividend for was $ per share.
d All shortterm investments are cash equivalents.
Perform a horizontal analysis on the balance sheets for and
Always use cell references and formulas where appropriate to receive full credit. If you copypaste from the Instructions tab you will be marked wrong. All values should be added as positive numbers.
RIVERSIDE SWEETS
RIVERSIDE SWEETS Balance Sheet June and Increa ecrease Amount Percentage Assets Current Assets: Cash $ $ Shortterm Investments Accounts Receivable Merchandise Inventory Other Current Assets Total Current Assets Property, Plant, and Equipment Total Assets $ $ Liabilities Current Liabilities: Accounts Payable $ $ Accrued Liabilities Total Current Liabilities Longterm Liabilities Bonds Payable Mortgage Payable Total Longterm Liabilities Total Liabilities Stockholders' Equity Common Stock, $ par, shares issued and outstanding PaidIn Capital in Excess of Par Retained Earnings Total Stockholders' Equity Total Liabilities and Stockholders' Equity $ $
HINTS
For cell references, begin the formula with an equals sign use the balance in this worksheet for your calculations, and press the enter key.
Perform a vertical analysis on the income statement.
Always use cell references and formulas where appropriate to receive full credit. If you copypaste from the Instructions tab you will be marked wrong. All values should be added as positive numbers.
HINTS
For cell references, begin the formula with an equals sign use the income statement in this worksheet for your calculations, and press the enter key.
Compute the following ratios. Do not round your calculations.
Always use cell references and formulas where appropriate to receive full credit. If you copypaste from the Instructions tab you will be marked wrong. All values should be added as positive numbers.
Working Capital
Current Ratio
AcidTest Quick Ratio
Cash Ratio
Accounts Receivable Turnover
Days' Sales in Receivables
Inventory Turnover
Days' Sales in Inventory
Gross Profit Percentage
Debt Ratio
Debt to Equity Ratio
TimesInterestEarned Ratio
Profit Margin Ratio
Rate of Return on Total Assets
Asset Turnover Ratio
Rate of Return on Common Stockholders' Equity
Earnings per Share EPS
PriceEarnings Ratio
Dividend Yield
Dividend Payout
HINTS
Cell Hint:
C Begin the formula with an equals sign use the balance in the horizontal analysis worksheet for your calculations, and press the enter key.
C Use the function SUM to calculate the numerator.
CVertical Analysis'!CHorizontal Analysis'!C'Horizontal Analysis'!D
C Assume days in a year and use the correct ratio in this worksheet for your calculations.
Step by Step Solution
There are 3 Steps involved in it
1 Expert Approved Answer
Step: 1 Unlock

Question Has Been Solved by an Expert!
Get step-by-step solutions from verified subject matter experts
Step: 2 Unlock
Step: 3 Unlock