

Question: Please help me fill out the excel sheet a=4 b=6 c=9 d=0 this is the example of what it should look like You are the
Please help me fill out the excel sheet
a=4 b=6 c=9 d=0
this is the example of what it should look like
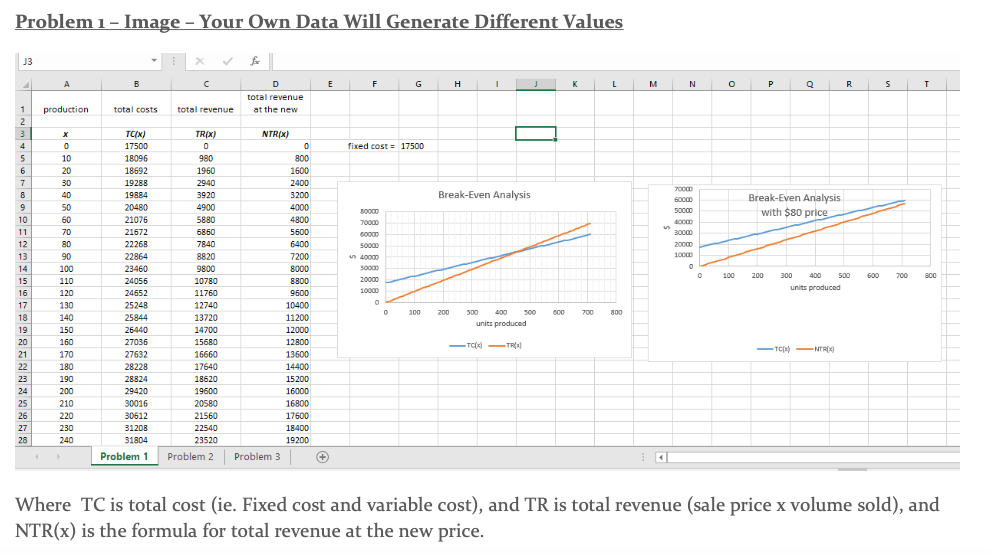
You are the newly appointed manager of WinTech, a small local manufacturer of single board computers (SBC) that uses a wholesaler for distribution. a) On the "Problem 1 " worksheet of the Excel workbook, enter formulas for costs and revenues into your Excel worksheet to create a table of values. See the end of this document, what your completed work should look like for problem 1 . b) In your excel spreadsheet (worksheet problem one) determine functions TC(x) for total cost and TR(x) for total revenue, where x is the number of sensors produced over a month, and NTR( x) for total revenue at the new sale price using the designated values from your student number. In your data sheet choose the minimum value of x to be 0 and increment by 10 up to the full capacity. Formulas are as follows: During the first few days on the job, you create (in wour excel spreadsheet on the problem one worksheet tab) the following data about the company: Total capacity formula (substituting the sariables using the appropriate digits from your student number): - WinTech has the capacity to produce in quantities: 10(70+A)SBCs per month. This is the end point for your data. Your total costs should not exceed this capacity for the value of " X ". This is operating at total maximum capacity. Current production rate (substituting the variables using the appropriate digits from your studentumber): - Current production rate in quantity: (500+10B) SBCs per month. This is an operating level that is less than maximum capacity. Fixed costs formula (substituting the variables using the appropriate digits from your student number).: - The company's monthly expenses are: - rent expense =1000(1+C) - salaries expense =100(120+D) insurance expense =100(A+B+C+5) Variable cost formula (substituting the variables using the appropriate digits from your student number): - The company's expense per sensor are (variable cost per sensor): - Materials cost per unit =6+10A - Labour cost per unit =30+2B+C - Sales commission per unit =25D Sale price per unit (substituting the variables using the appropriate digits from your student number): - Each sensor is sold for : sale price =100+AB+CD dollars. c) Create a graph in Excel showing the cost TC(x) and revenue TR(x) functions. Give the graph a title, and label the axes. Insert the graph into your Word document. d) What is the break-even wolume and break-even revenue per month? Explain how this is seen in the graph. e) How much net income per month is earned at the current level of production? Explain how this is found on the graph. f) You are considering to increase the quantity produced to the facility's capacity and reduce the selling price to \$80. On the "Project 1 " worksheet, enter values for the new total revenue NTR(x). Create a break-even analvsis graph for these new values and insert it within your Word document. What would be the impact of this decision on the company's net income? Problem 1 - Image - Your Own Data Will Generate Different Values x&fx Where TC is total cost (ie. Fixed cost and variable cost), and TR is total revenue (sale price x volume sold), and NTR(x) is the formula for total revenue at the new price
Step by Step Solution
There are 3 Steps involved in it

Get step-by-step solutions from verified subject matter experts