

Question: Please help me fill this chart out and draw a bar graph or histogram on the amounts with respect to elements. The y-axis to be
Please help me fill this chart out 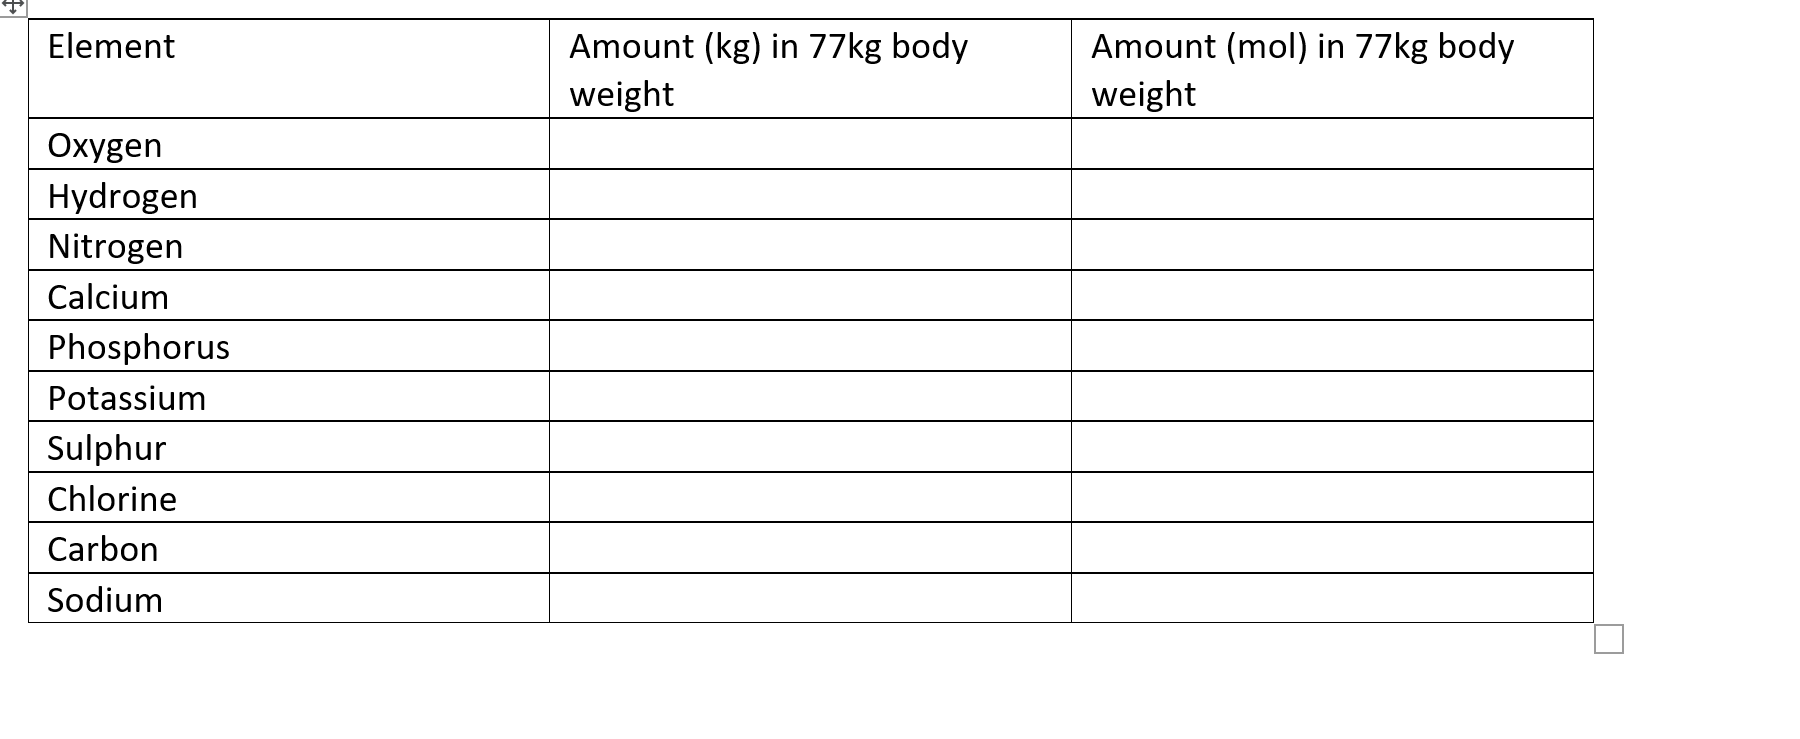 and draw a bar graph or histogram on the amounts with respect to elements. The y-axis to be the amount of element and x-axis to be the name of element.
\begin{tabular}{|l|l|l|} \hline Element & Amount(kg)in77kgbodyweight & Amount(mol)in77kgbodyweight \\ \hline Oxygen & & \\ \hline Hydrogen & & \\ \hline Nitrogen & & \\ \hline Calcium & & \\ \hline Phosphorus & & \\ \hline Potassium & & \\ \hline Sulphur & & \\ \hline Chlorine & & \\ \hline Carbon & & \\ \hline Sodium & & \\ \hline \end{tabular}
Step by Step Solution
There are 3 Steps involved in it
1 Expert Approved Answer
Step: 1 Unlock

Question Has Been Solved by an Expert!
Get step-by-step solutions from verified subject matter experts
Step: 2 Unlock
Step: 3 Unlock