

Question: Please help me find all the calculations and make the 4 graphs (preferably on EXCEL) Data Table 5.1. The Turnip Peroxidase Standardization Raculte Data Table
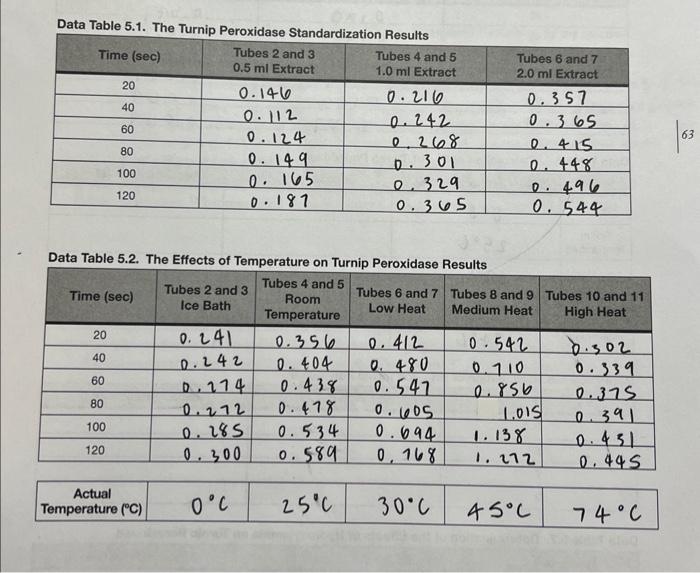
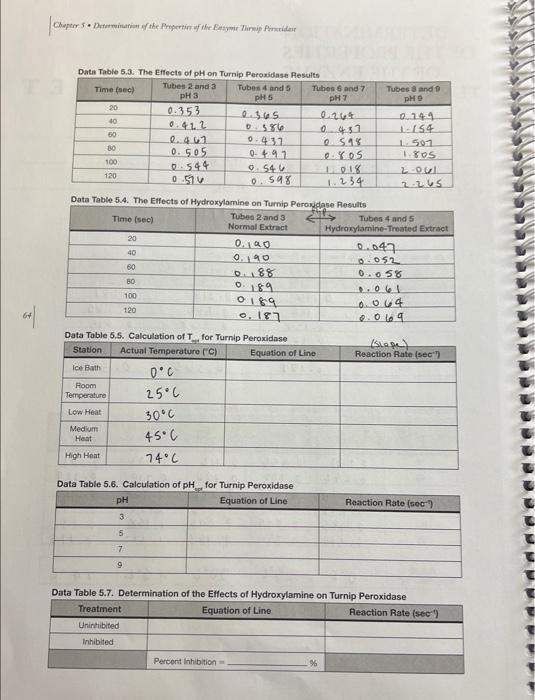
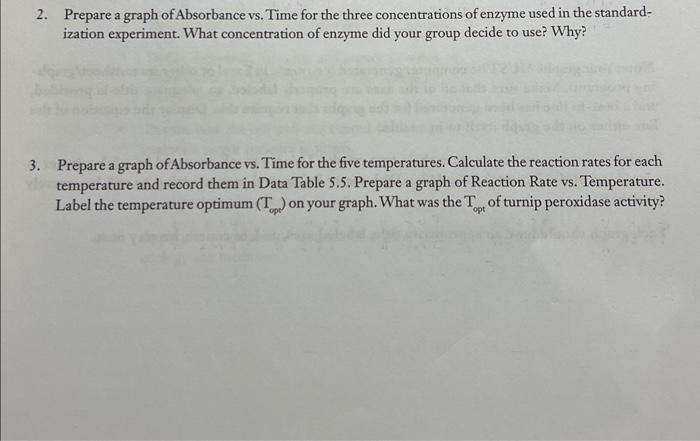
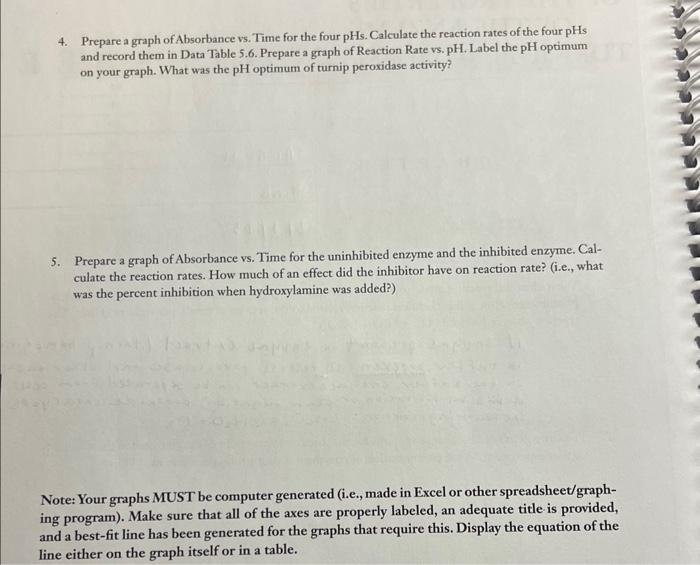
Data Table 5.1. The Turnip Peroxidase Standardization Raculte Data Table 5.2. The Effects of Temperature on Turnip Peroxidase Results Data Table 5.3. The Effects of pH on Turnio Peraxinlana Pascite Data Table 5.4. The Eifects of Hydroxylamine on Turnin Pernvirlana Pesealin Data Table 5.5. Calculation of T for Turnin Damvinman Data Table 5.6. Calculation of pH _ for Turnip Peroxidase Data Table 5.7. Determination of the Etfects of Hydroxylamine on Turnip Peroxidase 2. Prepare a graph of Absorbance vs. Time for the three concentrations of enzyme used in the standardization experiment. What concentration of enzyme did your group decide to use? Why? Prepare a graph of Absorbance vs. Time for the five temperatures. Calculate the reaction rates for each temperature and record them in Data Table 5.5. Prepare a graph of Reaction Rate vs. Temperature. Label the temperature optimum ( Topp ) on your graph. What was the Topt of turnip peroxidase activity? 4. Prepare a graph of Absorbance vs. Time for the four pHs. Calculate the reaction rates of the four pHs and record them in Data Table 5.6. Prepare a graph of Reaction Rate vs. pH. Label the pH optimum on your graph. What was the pH optimum of turnip peroxidase activity? 5. Prepare a graph of Absorbance vs. Time for the uninhibited enzyme and the inhibited enzyme. Calculate the reaction rates. How much of an effect did the inhibitor have on reaction rate? (i.e., what was the percent inhibition when hydroxylamine was added?) Note: Your graphs MUST be computer generated (i.e., made in Excel or other spreadsheet/graphing program). Make sure that all of the axes are properly labeled, an adequate title is provided, and a best-fit line has been generated for the graphs that require this. Display the equation of the line either on the graph itself or in a table. Data Table 5.1. The Turnip Peroxidase Standardization Raculte Data Table 5.2. The Effects of Temperature on Turnip Peroxidase Results Data Table 5.3. The Effects of pH on Turnio Peraxinlana Pascite Data Table 5.4. The Eifects of Hydroxylamine on Turnin Pernvirlana Pesealin Data Table 5.5. Calculation of T for Turnin Damvinman Data Table 5.6. Calculation of pH _ for Turnip Peroxidase Data Table 5.7. Determination of the Etfects of Hydroxylamine on Turnip Peroxidase 2. Prepare a graph of Absorbance vs. Time for the three concentrations of enzyme used in the standardization experiment. What concentration of enzyme did your group decide to use? Why? Prepare a graph of Absorbance vs. Time for the five temperatures. Calculate the reaction rates for each temperature and record them in Data Table 5.5. Prepare a graph of Reaction Rate vs. Temperature. Label the temperature optimum ( Topp ) on your graph. What was the Topt of turnip peroxidase activity? 4. Prepare a graph of Absorbance vs. Time for the four pHs. Calculate the reaction rates of the four pHs and record them in Data Table 5.6. Prepare a graph of Reaction Rate vs. pH. Label the pH optimum on your graph. What was the pH optimum of turnip peroxidase activity? 5. Prepare a graph of Absorbance vs. Time for the uninhibited enzyme and the inhibited enzyme. Calculate the reaction rates. How much of an effect did the inhibitor have on reaction rate? (i.e., what was the percent inhibition when hydroxylamine was added?) Note: Your graphs MUST be computer generated (i.e., made in Excel or other spreadsheet/graphing program). Make sure that all of the axes are properly labeled, an adequate title is provided, and a best-fit line has been generated for the graphs that require this. Display the equation of the line either on the graph itself or in a table
Step by Step Solution
There are 3 Steps involved in it

Get step-by-step solutions from verified subject matter experts