

Question: Please help me fix the Under/Over valued tables in this sensitivity analysis. Please explain what I should enter into excel and guide me through the
Please help me fix the Under/Over valued tables in this sensitivity analysis. Please explain what I should enter into excel and guide me through the steps. I need to learn this rather than simply be told the correct answers. Thank you so much! I always thumbs up if correct.
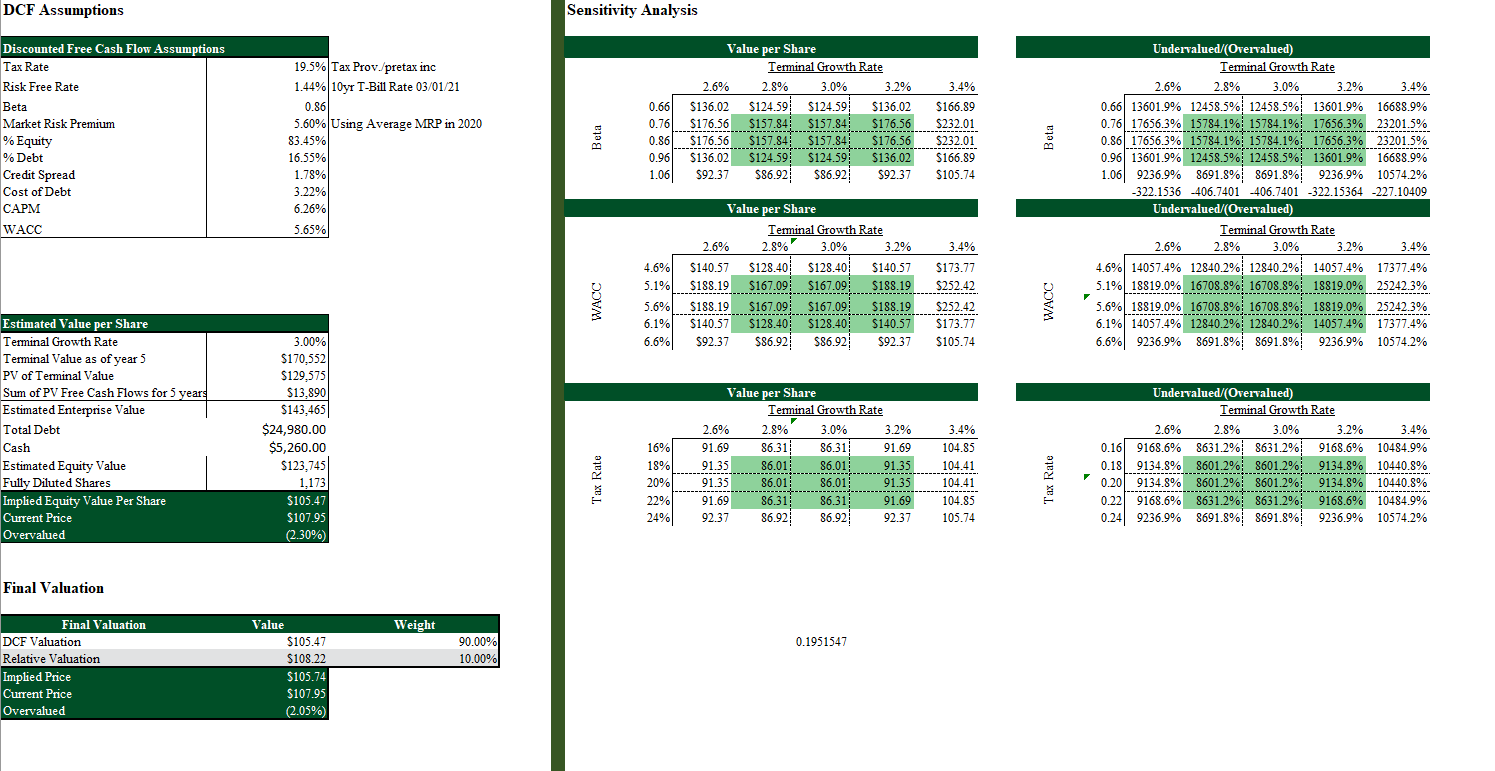
DCF Assumptions Sensitivity Analysis Discounted Free Cash Flow Assumptions Tax Rate Risk Free Rate Beta Market Risk Premium % Equity % Debt Credit Spread Cost of Debt CAPM WACC 19.5% Tax Prov./pretax inc 1.44% 10yr T-Bill Rate 03/01/21 0.86 5.60% Using Average MRP in 2020 83.45% 16.55% 1.78% 3.22% 6.26% 5.65% Value per Share Terminal Growth Rate 2.6% 2.8% 3.0% 3.2% $136.02 $124.59 $124.59 $136.02 $176.56 S157.841 S157.841 $176.56 $176.56 $157.84 $157.84 S176.56 $136.02 $124.59 $124.59 $136.02 $92.37 586.92 $86.92 $92.37 0.66 0.76 0.86 0.96 1.06 Beta 3.4% $166.89 S232.01 $232.01 $166.89 $105.74 Undervalued (Overvalued) Terminal Growth Rate 2.6% 2.8% 3.0% 3.2% 3.4% 0.66 13601.9% 12458.5% 12458.5% 13601.9% 16688.9% 0.76 17656.3% 15784.1% 15784.1% 17656.3% 23201.5% 0.86 17656.3% 15784.1% 15784.1% 17656.3% 23201.5% 0.96 13601.9% 12458.5% 12458.5% 13601.9% 16688.9% 1.06 9236.9% 8691.8% 8691.8% 9236.9% 10574.2% -322.1536 -406.7401-406.7401 -322.15364 -227.10409 Undervalued/(Overvalued) Terminal Growth Rate 2.6% 2.8% 3.0% 3.2% 3.4% 4.6% 14057.4% 12840.2% 12840.2% 14057.4% 17377.4% 5.1% 18819.0% 16708.8%16708.8% 18819.0% 25242.3% 5.6% 18819.0% 16708.8% 16708.8% 18819.0% 25242.3% 6.1% 14057.4% 12840.2% 12840.2% 14057.4% 17377.4% 6.6% 9236.9% 8691.8% 8691.8% 9236.9% 10574.2% 3.4% 4.6% 5.1% Value per Share Terminal Growth Rate 2.6% 2.8% 3.0% 3.2% $140.57 $128.40 $128.40 $140.57 S188.19 $167.09 $167.09 S188.19 S188.19 $167.09 $167.09 S188.19 10-10 S140.57 $128.40 $128.40 $140.57 $92.37 586.92 586.92 $92.37 S173.77 $252.42 WACC $252.42 WACC 5.6% 6.1% 6.6% $173.77 $105.74 Estimated Value per Share Terminal Growth Rate Terminal Value as of year 5 PV of Terminal Value Sum of PV Free Cash Flows for 5 years Estimated Enterprise Value Total Debt Cash Estimated Equity Value Fully Diluted Shares Implied Equity Value Per Share Current Price Overvalued 3.00% $170,552) $129,575 $13,890 $143,465 $24,980.00 $5,260.00 $123,745 1,173 $105.47 $107.95 (2.30%) Value per Share Terminal Growth Rate 2.6% 2.8% 3.0% 3.2% 91.69 86.31 86.31 91.69 91.35 86.01 86.01 91.35 91.35 86.01 86.01 91.35 91.69 86.31 86.31 91.69 92.37 86.92 86.92 92.37 16% 18% 20% 22% 24% Tax Rate 3.4% 104.85 104.41 104.41 104.85 105.74 Undervalued/(Overvalued) Terminal Growth Rate 2.6% 2.8% 3.0% 3.2% % 3.4% 0.16 9168.6% 8631.2% 8631.2% 9168.6% 10484.9% 0.18 9134.8% 8601.2% 8601.2% 9134.8% 10440.8% 0.20 9134.8% 8601.2% 8601.2% 9134.8% 10440.8% 0.22 9168.6% 8631.2% 8631.2% 9168.6% 10484.9% 0.24 9236.9% 8691.8% 8691.8% 9236.9% 10574.2% Tax Rate Final Valuation Weight 0.1951547 90.00% 10.00% Final Valuation DCF Valuation Relative Valuation Implied Price Current Price Overvalued Value $105.47 S108.22 $105.74 $107.95 (2.05%) DCF Assumptions Sensitivity Analysis Discounted Free Cash Flow Assumptions Tax Rate Risk Free Rate Beta Market Risk Premium % Equity % Debt Credit Spread Cost of Debt CAPM WACC 19.5% Tax Prov./pretax inc 1.44% 10yr T-Bill Rate 03/01/21 0.86 5.60% Using Average MRP in 2020 83.45% 16.55% 1.78% 3.22% 6.26% 5.65% Value per Share Terminal Growth Rate 2.6% 2.8% 3.0% 3.2% $136.02 $124.59 $124.59 $136.02 $176.56 S157.841 S157.841 $176.56 $176.56 $157.84 $157.84 S176.56 $136.02 $124.59 $124.59 $136.02 $92.37 586.92 $86.92 $92.37 0.66 0.76 0.86 0.96 1.06 Beta 3.4% $166.89 S232.01 $232.01 $166.89 $105.74 Undervalued (Overvalued) Terminal Growth Rate 2.6% 2.8% 3.0% 3.2% 3.4% 0.66 13601.9% 12458.5% 12458.5% 13601.9% 16688.9% 0.76 17656.3% 15784.1% 15784.1% 17656.3% 23201.5% 0.86 17656.3% 15784.1% 15784.1% 17656.3% 23201.5% 0.96 13601.9% 12458.5% 12458.5% 13601.9% 16688.9% 1.06 9236.9% 8691.8% 8691.8% 9236.9% 10574.2% -322.1536 -406.7401-406.7401 -322.15364 -227.10409 Undervalued/(Overvalued) Terminal Growth Rate 2.6% 2.8% 3.0% 3.2% 3.4% 4.6% 14057.4% 12840.2% 12840.2% 14057.4% 17377.4% 5.1% 18819.0% 16708.8%16708.8% 18819.0% 25242.3% 5.6% 18819.0% 16708.8% 16708.8% 18819.0% 25242.3% 6.1% 14057.4% 12840.2% 12840.2% 14057.4% 17377.4% 6.6% 9236.9% 8691.8% 8691.8% 9236.9% 10574.2% 3.4% 4.6% 5.1% Value per Share Terminal Growth Rate 2.6% 2.8% 3.0% 3.2% $140.57 $128.40 $128.40 $140.57 S188.19 $167.09 $167.09 S188.19 S188.19 $167.09 $167.09 S188.19 10-10 S140.57 $128.40 $128.40 $140.57 $92.37 586.92 586.92 $92.37 S173.77 $252.42 WACC $252.42 WACC 5.6% 6.1% 6.6% $173.77 $105.74 Estimated Value per Share Terminal Growth Rate Terminal Value as of year 5 PV of Terminal Value Sum of PV Free Cash Flows for 5 years Estimated Enterprise Value Total Debt Cash Estimated Equity Value Fully Diluted Shares Implied Equity Value Per Share Current Price Overvalued 3.00% $170,552) $129,575 $13,890 $143,465 $24,980.00 $5,260.00 $123,745 1,173 $105.47 $107.95 (2.30%) Value per Share Terminal Growth Rate 2.6% 2.8% 3.0% 3.2% 91.69 86.31 86.31 91.69 91.35 86.01 86.01 91.35 91.35 86.01 86.01 91.35 91.69 86.31 86.31 91.69 92.37 86.92 86.92 92.37 16% 18% 20% 22% 24% Tax Rate 3.4% 104.85 104.41 104.41 104.85 105.74 Undervalued/(Overvalued) Terminal Growth Rate 2.6% 2.8% 3.0% 3.2% % 3.4% 0.16 9168.6% 8631.2% 8631.2% 9168.6% 10484.9% 0.18 9134.8% 8601.2% 8601.2% 9134.8% 10440.8% 0.20 9134.8% 8601.2% 8601.2% 9134.8% 10440.8% 0.22 9168.6% 8631.2% 8631.2% 9168.6% 10484.9% 0.24 9236.9% 8691.8% 8691.8% 9236.9% 10574.2% Tax Rate Final Valuation Weight 0.1951547 90.00% 10.00% Final Valuation DCF Valuation Relative Valuation Implied Price Current Price Overvalued Value $105.47 S108.22 $105.74 $107.95 (2.05%)
Step by Step Solution
There are 3 Steps involved in it

Get step-by-step solutions from verified subject matter experts