

Question: Please help me for my homework Question 1 , 2 and 3 Assume that you recently graduated and have just reported to work as an
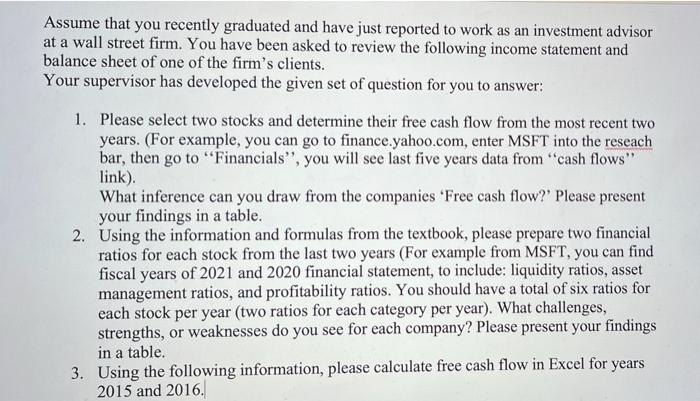
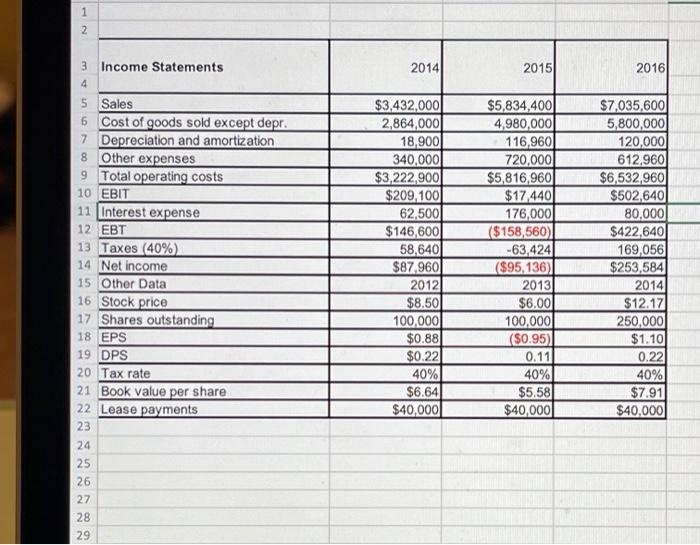
Assume that you recently graduated and have just reported to work as an investment advisor at a wall street firm. You have been asked to review the following income statement and balance sheet of one of the firm's clients. Your supervisor has developed the given set of question for you to answer: 1. Please select two stocks and determine their free cash flow from the most recent two years. (For example, you can go to finance.yahoo.com, enter MSFT into the reseach bar, then go to Financials", you will see last five years data from "cash flows" link) What inference can you draw from the companies 'Free cash flow?' Please present your findings in a table. 2. Using the information and formulas from the textbook, please prepare two financial ratios for each stock from the last two years (For example from MSFT, you can find fiscal years of 2021 and 2020 financial statement, to include: liquidity ratios, asset management ratios, and profitability ratios. You should have a total of six ratios for each stock per year (two ratios for each category per year). What challenges, strengths, or weaknesses do you see for each company? Please present your findings in a table. 3. Using the following information, please calculate free cash flow in Excel for years 2015 and 2016. 1 2 3 Income Statements 4 2014 2015 2016) 5 Sales 6 Cost of goods sold except depr. 7 Depreciation and amortization 8 Other expenses 9 Total operating costs 10 EBIT 11 Interest expense 12 EBT 13 Taxes (40%) 14 Net income 15 Other Data 16 Stock price 17 Shares outstanding 18 EPS 19 DPS 20 Tax rate 21 Book value per share 22 Lease payments 23 24 25 26 27 28 29 $3,432,000 2,864,000 18,9001 340,000 $3,222,900 $209,100 62,500 $146,6001 58,640 $87,960 2012 $8.50 100,000 $0.88 $0.22 40% $6.64 $40,000 $5,834,400 4,980,000 116,960 720,000 $5,816,960 $17440 176,000 ($158,560) -63,424 ($95,136) 2013 $6.00 100,000 ($0.95) 0.11 40% $5.58 $40,000 $7,035,600 5,800,000 120,000 612,960 $6,532,960 $502,640) 80,000 $422,640 169,056 $253,584 2014 $12.17 250,000 $1.10 0.22 40% $7.91 $40,000 NNNNN F G H Balance Sheets 2014 2015 2016 $9,000 48,600 351,200 715,200 $1,124,000 491,000 146,200 $344,800 $1,468,800 $7.282 20,000 632,160 1,287,360 $1,946,802 1,202,950 263,160 $939,790 $2.886,592 $14.000 71,632 878,000 1,716,4801 $2,680,112 1,220,000 383,160 $836,840 $3,516,952 Cash Short-term investments Accounts receivable Inventories Total current assets Gross fixed assets Less: Accumulated depreciation Net fixed assets Total assets Liabilities and Equity Accounts payable Notes payable Accruals Total current liabilities LO rm debt Common stock (100,000 shares) Retained earnings Total equity Total liabilities and equity $145,600 200,000 136,000 $481,600 323,432) 460,000 203,768 $663,7681 $1,468,800 $324,000 720,000 284,960 $1,328,960 1,000,000 460,000 97,632 $557,632 $2,886,592 $359,800 300,000 380,000 $1,039,800 500,000 1,680,936 296,216 $1,977 152 $3,516,952 Assume that you recently graduated and have just reported to work as an investment advisor at a wall street firm. You have been asked to review the following income statement and balance sheet of one of the firm's clients. Your supervisor has developed the given set of question for you to answer: 1. Please select two stocks and determine their free cash flow from the most recent two years. (For example, you can go to finance.yahoo.com, enter MSFT into the reseach bar, then go to Financials", you will see last five years data from "cash flows" link) What inference can you draw from the companies 'Free cash flow?' Please present your findings in a table. 2. Using the information and formulas from the textbook, please prepare two financial ratios for each stock from the last two years (For example from MSFT, you can find fiscal years of 2021 and 2020 financial statement, to include: liquidity ratios, asset management ratios, and profitability ratios. You should have a total of six ratios for each stock per year (two ratios for each category per year). What challenges, strengths, or weaknesses do you see for each company? Please present your findings in a table. 3. Using the following information, please calculate free cash flow in Excel for years 2015 and 2016. 1 2 3 Income Statements 4 2014 2015 2016) 5 Sales 6 Cost of goods sold except depr. 7 Depreciation and amortization 8 Other expenses 9 Total operating costs 10 EBIT 11 Interest expense 12 EBT 13 Taxes (40%) 14 Net income 15 Other Data 16 Stock price 17 Shares outstanding 18 EPS 19 DPS 20 Tax rate 21 Book value per share 22 Lease payments 23 24 25 26 27 28 29 $3,432,000 2,864,000 18,9001 340,000 $3,222,900 $209,100 62,500 $146,6001 58,640 $87,960 2012 $8.50 100,000 $0.88 $0.22 40% $6.64 $40,000 $5,834,400 4,980,000 116,960 720,000 $5,816,960 $17440 176,000 ($158,560) -63,424 ($95,136) 2013 $6.00 100,000 ($0.95) 0.11 40% $5.58 $40,000 $7,035,600 5,800,000 120,000 612,960 $6,532,960 $502,640) 80,000 $422,640 169,056 $253,584 2014 $12.17 250,000 $1.10 0.22 40% $7.91 $40,000 NNNNN F G H Balance Sheets 2014 2015 2016 $9,000 48,600 351,200 715,200 $1,124,000 491,000 146,200 $344,800 $1,468,800 $7.282 20,000 632,160 1,287,360 $1,946,802 1,202,950 263,160 $939,790 $2.886,592 $14.000 71,632 878,000 1,716,4801 $2,680,112 1,220,000 383,160 $836,840 $3,516,952 Cash Short-term investments Accounts receivable Inventories Total current assets Gross fixed assets Less: Accumulated depreciation Net fixed assets Total assets Liabilities and Equity Accounts payable Notes payable Accruals Total current liabilities LO rm debt Common stock (100,000 shares) Retained earnings Total equity Total liabilities and equity $145,600 200,000 136,000 $481,600 323,432) 460,000 203,768 $663,7681 $1,468,800 $324,000 720,000 284,960 $1,328,960 1,000,000 460,000 97,632 $557,632 $2,886,592 $359,800 300,000 380,000 $1,039,800 500,000 1,680,936 296,216 $1,977 152 $3,516,952
Step by Step Solution
There are 3 Steps involved in it

Get step-by-step solutions from verified subject matter experts