

Question: Please help me for solving this question of statistics subject as soon as possible and please explain each and every aspect of it. 4) According
Please help me for solving this question of statistics subject as soon as possible and please explain each and every aspect of it.
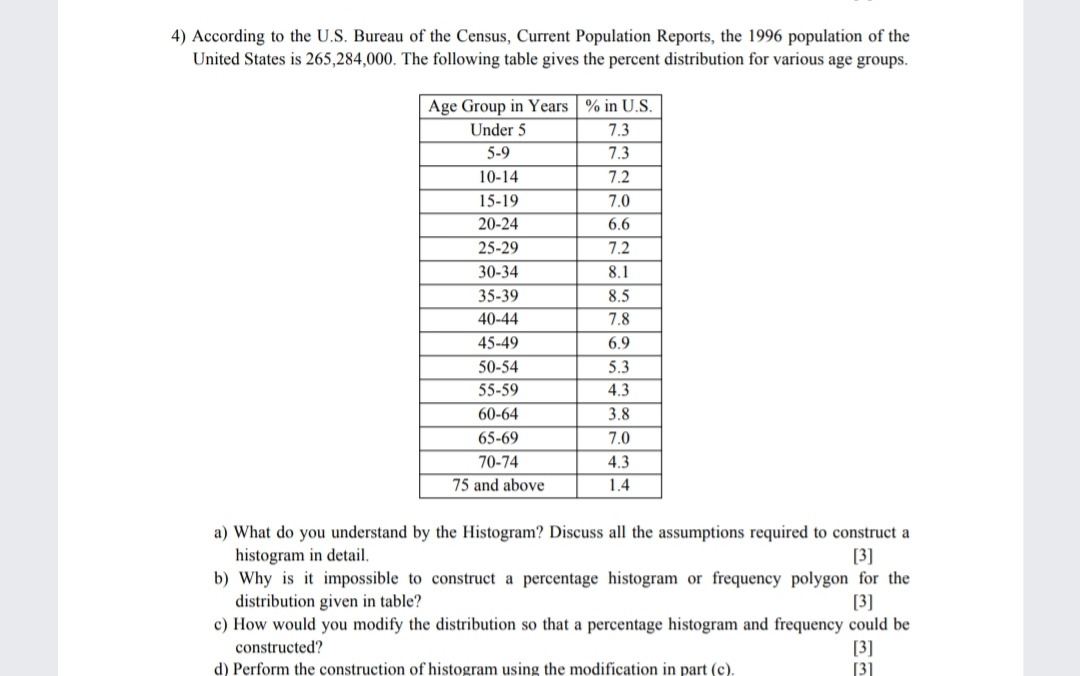
4) According to the U.S. Bureau of the Census, Current Population Reports, the 1996 population of the United States is 265,284,000. The following table gives the percent distribution for various age groups. Age Group in Years % in U.S. Under 5 7.3 5-9 7.3 10-14 7.2 15-19 7.0 20-24 6.6 25-29 7.2 30-34 8.1 35-39 8.5 40-44 7.8 45-49 6.9 50-54 5.3 55-59 4.3 60-64 3.8 65-69 7.0 70-74 4.3 75 and above 1.4 a) What do you understand by the Histogram? Discuss all the assumptions required to construct a histogram in detail. [3] b) Why is it impossible to construct a percentage histogram or frequency polygon for the distribution given in table? [3] c) How would you modify the distribution so that a percentage histogram and frequency could be constructed? [3] d) Perform the construction of histogram using the modification in part (c)
Step by Step Solution
There are 3 Steps involved in it

Get step-by-step solutions from verified subject matter experts