

Question: Please help me for solving this question on ms Excel please explain each and every step of solving this question of statistics subject. 1) Assume
Please help me for solving this question on ms Excel please explain each and every step of solving this question of statistics subject.
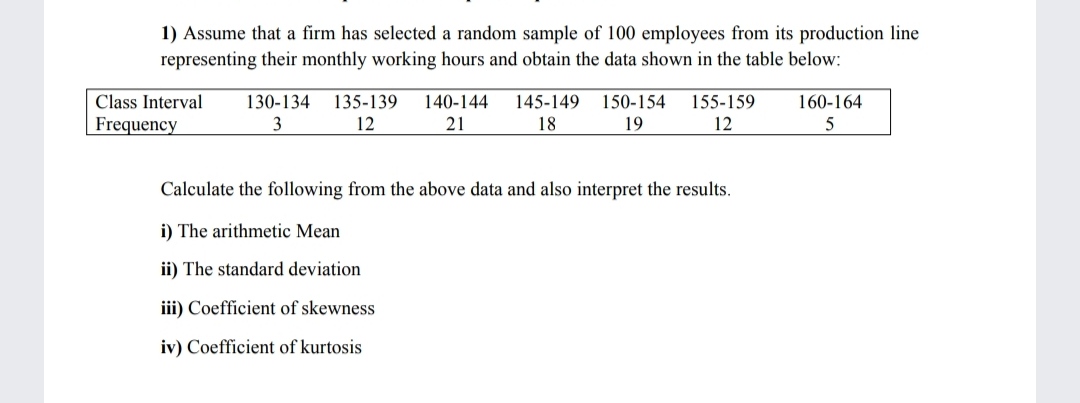
1) Assume that a firm has selected a random sample of 100 employees from its production line representing their monthly working hours and obtain the data shown in the table below: Class Interval 130-134 135-139 140-144 145-149 150-154 155-159 160-164 Frequency 3 12 21 18 19 12 5 Calculate the following from the above data and also interpret the results. i) The arithmetic Mean ii) The standard deviation iii) Coefficient of skewness iv) Coefficient of kurtosis
Step by Step Solution
There are 3 Steps involved in it
1 Expert Approved Answer
Step: 1 Unlock

Question Has Been Solved by an Expert!
Get step-by-step solutions from verified subject matter experts
Step: 2 Unlock
Step: 3 Unlock