

Question: Please help me Given United airline information below Using the information on the Value Line Investment Report, calculate the intrinsic value applying following three equity
Please help me
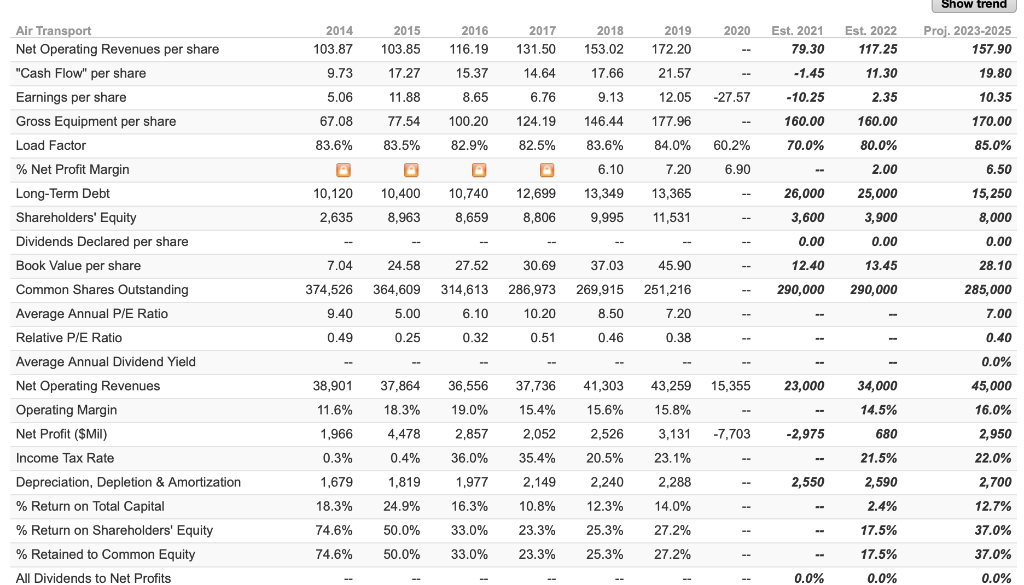
Given United airline information below
- Using the information on the Value Line Investment Report, calculate the "intrinsic value" applying following three equity valuation models in Excel and suggest your "12-month Target Price" for the assigned firm.
i. Multistage Dividend Discount Model (at-least 3 stages of growth)
ii. Free Cash Flow to Equity
iii. Free Cash Flow to Firm
2. Using Bloomberg "Analyst Recommendations" for the firm in previous part, compare and
discuss the intrinsic stock price calculated by your excel models and 12-month Target Price reported in Bloomberg ANR report.
Show trend 2016 2020 2014 103.87 9.73 2015 103.85 2017 131.50 2018 153.02 17.66 2019 172.20 Est. 2021 79.30 Est. 2022 117.25 116.19 Proj. 2023-2025 157.90 19.80 17.27 14.64 21.57 -1.45 11.30 15.37 8.65 11.88 6.76 9.13 12.05 -27.57 - 10.25 2.35 10.35 5.06 67.08 83.6% 100.20 124.19 177.96 160.00 170.00 77.54 83.5% 146.44 83.6% 82.9% 82.5% 70.0% 85.0% 84.0% 7.20 60.2% 6.90 6.10 160.00 80.0% 2.00 25,000 3,900 6.50 15, 250 10,120 2,635 10,400 8,963 10,740 8,659 12,699 8,806 13,349 9,995 13,365 11,531 26,000 3,600 8,000 0.00 0.00 0.00 Air Transport Net Operating Revenues per share "Cash Flow" per share Earnings per share Gross Equipment per share Load Factor % Net Profit Margin Long-Term Debt Shareholders' Equity Dividends Declared per share Book Value per share Common Shares Outstanding Average Annual P/E Ratio Relative P/E Ratio Average Annual Dividend Yield Net Operating Revenues Operating Margin Net Profit ($Mil) Income Tax Rate Depreciation, Depletion & Amortization 27.52 30.69 37.03 45.90 12.40 13.45 28.10 314,613 286,973 269,915 251,216 290,000 290,000 285,000 7.04 24.58 374,526 364,609 9.40 5.00 0.49 0.25 6.10 10.20 8.50 7.20 7.00 0.32 0.51 0.46 0.38 0.40 0.0% 38,901 37,864 37,736 41,303 15,355 23,000 34,000 36,556 19.0% 43,259 15.8% 45,000 16.0% 11.6% 18.3% 15.4% 15.6% 14.5% 1,966 4,478 2,857 2,052 2,526 3,131 -7,703 -2,975 680 2,950 22.0% 0.4% 36.0% 35.4% 20.5% 21.5% 0.3% 1,679 23.1% 2,288 1,819 1,977 2,149 2.240 2,550 2,590 2,700 % Return on Total Capital 18.3% 24.9% 16.3% 10.8% 12.3% 14.0% 2.4% 12.7% 74.6% 50.0% 23.3% 25.3% 27.2% 17.5% 37.0% % Return on Shareholders' Equity % Retained to Common Equity All Dividends to Net Profits 33.0% 33.0% 74.6% 50.0% 23.3% 25.3% 27.2% 37.0% 17.5% 0.0% 0.0% 0.0% Show trend 2016 2020 2014 103.87 9.73 2015 103.85 2017 131.50 2018 153.02 17.66 2019 172.20 Est. 2021 79.30 Est. 2022 117.25 116.19 Proj. 2023-2025 157.90 19.80 17.27 14.64 21.57 -1.45 11.30 15.37 8.65 11.88 6.76 9.13 12.05 -27.57 - 10.25 2.35 10.35 5.06 67.08 83.6% 100.20 124.19 177.96 160.00 170.00 77.54 83.5% 146.44 83.6% 82.9% 82.5% 70.0% 85.0% 84.0% 7.20 60.2% 6.90 6.10 160.00 80.0% 2.00 25,000 3,900 6.50 15, 250 10,120 2,635 10,400 8,963 10,740 8,659 12,699 8,806 13,349 9,995 13,365 11,531 26,000 3,600 8,000 0.00 0.00 0.00 Air Transport Net Operating Revenues per share "Cash Flow" per share Earnings per share Gross Equipment per share Load Factor % Net Profit Margin Long-Term Debt Shareholders' Equity Dividends Declared per share Book Value per share Common Shares Outstanding Average Annual P/E Ratio Relative P/E Ratio Average Annual Dividend Yield Net Operating Revenues Operating Margin Net Profit ($Mil) Income Tax Rate Depreciation, Depletion & Amortization 27.52 30.69 37.03 45.90 12.40 13.45 28.10 314,613 286,973 269,915 251,216 290,000 290,000 285,000 7.04 24.58 374,526 364,609 9.40 5.00 0.49 0.25 6.10 10.20 8.50 7.20 7.00 0.32 0.51 0.46 0.38 0.40 0.0% 38,901 37,864 37,736 41,303 15,355 23,000 34,000 36,556 19.0% 43,259 15.8% 45,000 16.0% 11.6% 18.3% 15.4% 15.6% 14.5% 1,966 4,478 2,857 2,052 2,526 3,131 -7,703 -2,975 680 2,950 22.0% 0.4% 36.0% 35.4% 20.5% 21.5% 0.3% 1,679 23.1% 2,288 1,819 1,977 2,149 2.240 2,550 2,590 2,700 % Return on Total Capital 18.3% 24.9% 16.3% 10.8% 12.3% 14.0% 2.4% 12.7% 74.6% 50.0% 23.3% 25.3% 27.2% 17.5% 37.0% % Return on Shareholders' Equity % Retained to Common Equity All Dividends to Net Profits 33.0% 33.0% 74.6% 50.0% 23.3% 25.3% 27.2% 37.0% 17.5% 0.0% 0.0% 0.0%
Step by Step Solution
There are 3 Steps involved in it

Get step-by-step solutions from verified subject matter experts