

Question: Please help me I'm really struggling This is what I have so far but it isn't plotting anything when I try to run it (The
Please help me I'm really struggling
This is what I have so far but it isn't plotting anything when I try to run it (The commented out parts are because the second part asks me to use subplots to show when N is 10 and 100)
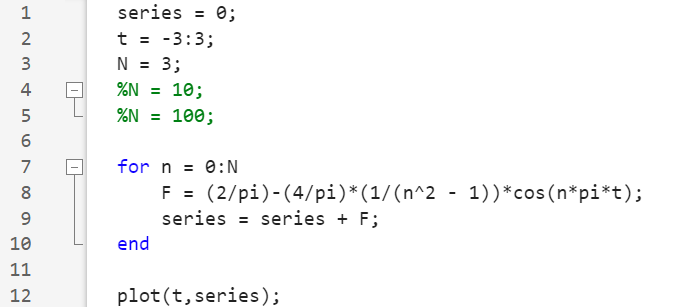
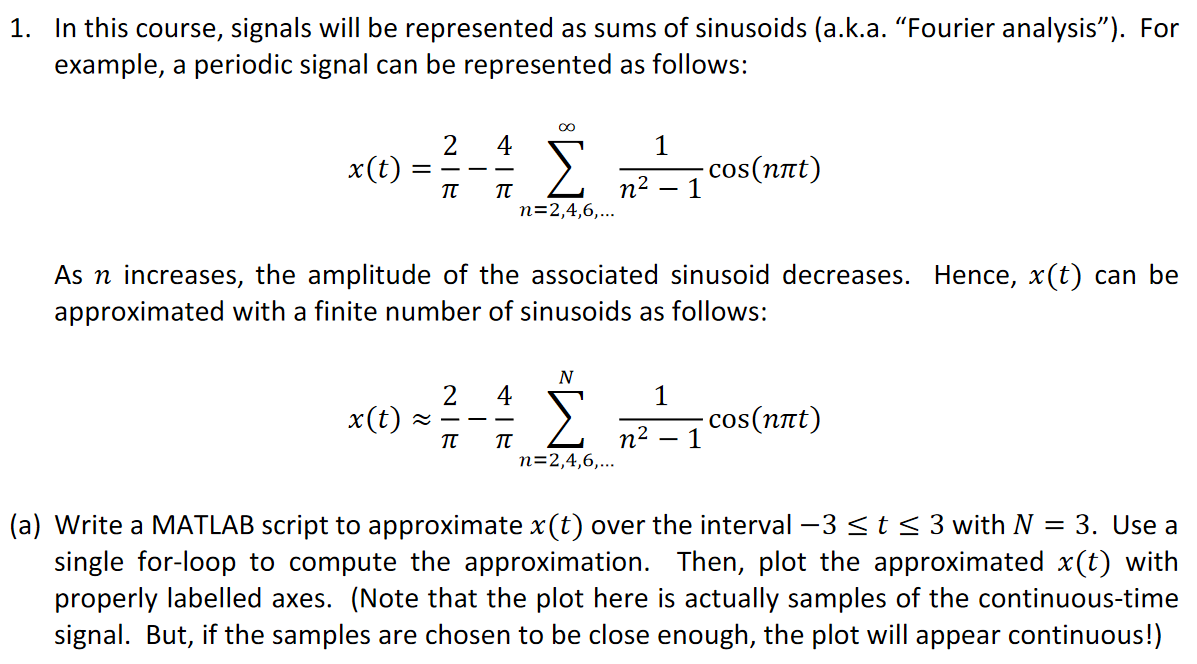
1. In this course, signals will be represented as sums of sinusoids (a.k.a. "Fourier analysis"). For example, a periodic signal can be represented as follows: x(t)=24n=2,4,6,n211cos(nt) As n increases, the amplitude of the associated sinusoid decreases. Hence, x(t) can be approximated with a finite number of sinusoids as follows: x(t)24n=2,4,6,Nn211cos(nt) a) Write a MATLAB script to approximate x(t) over the interval 3t3 with N=3. Use a single for-loop to compute the approximation. Then, plot the approximated x(t) with properly labelled axes. (Note that the plot here is actually samples of the continuous-time signal. But, if the samples are chosen to be close enough, the plot will appear continuous!) series =0 t=3:3 N=3; %N=10; %N=100; for n=0:N F=(2/pi)(4/pi)(1/(n21))cos(npit) series = series +F; end
Step by Step Solution
There are 3 Steps involved in it

Get step-by-step solutions from verified subject matter experts