

Question: Please help me, I'm really stuck on this! Email address: YourEmailHere@csuci.edu Assumptions and requirements for worksheet Original Data (3 Points) All your formula used in
Please help me, I'm really stuck on this!
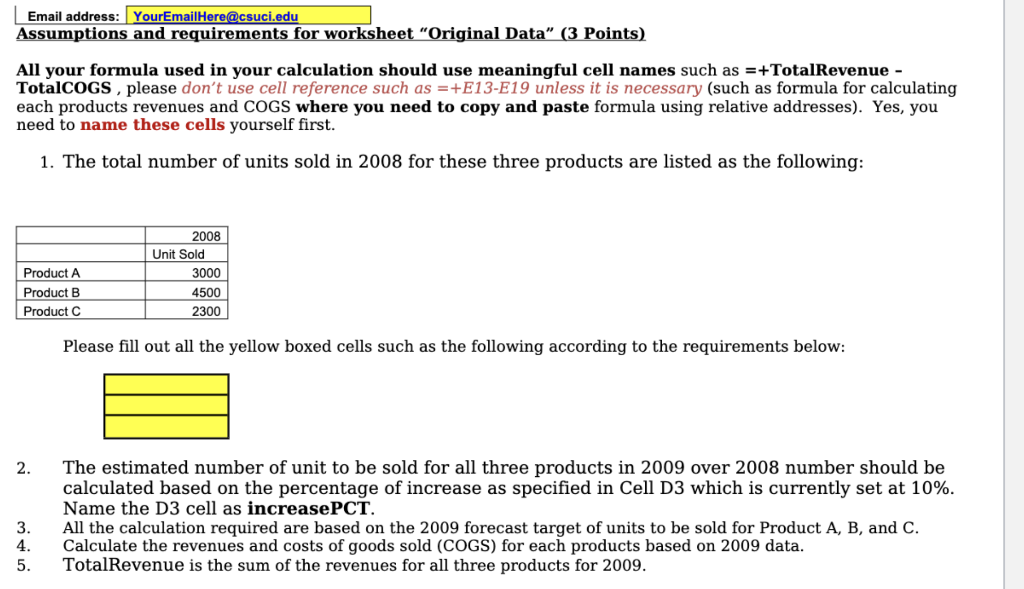
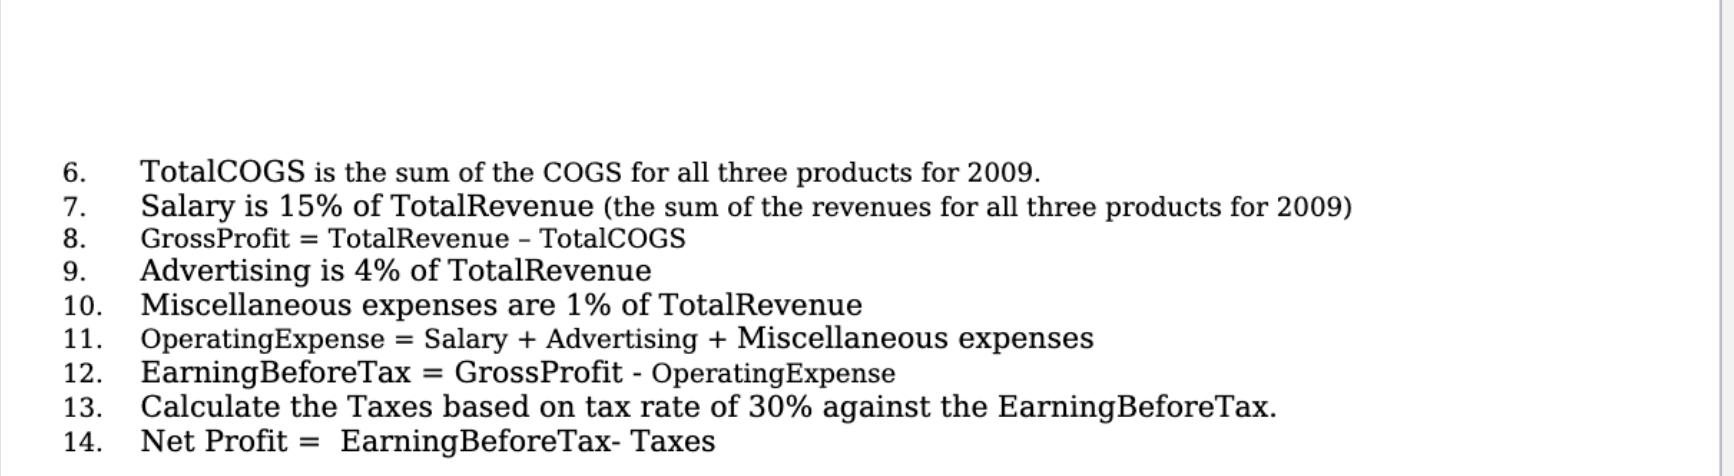
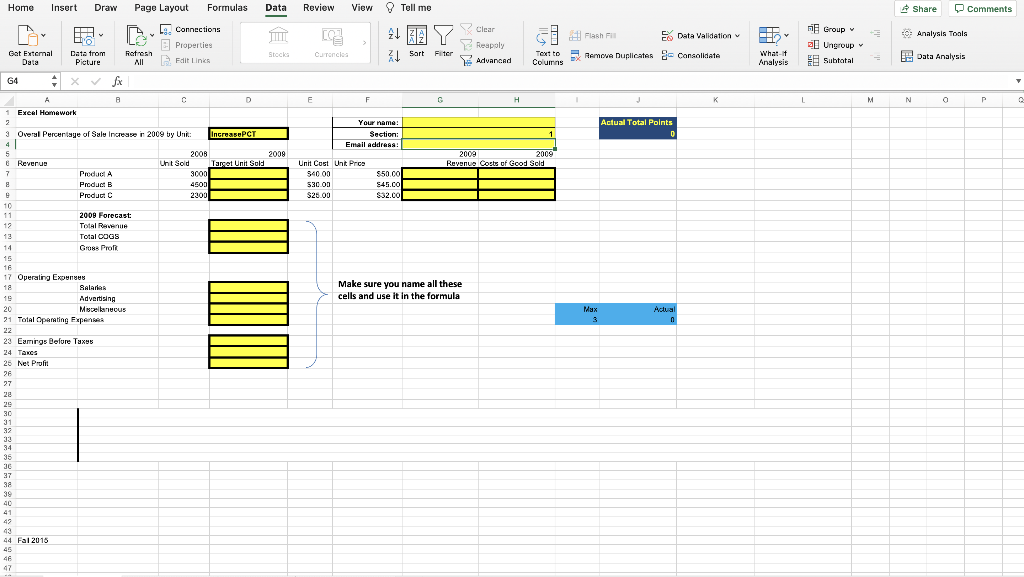
Email address: YourEmailHere@csuci.edu Assumptions and requirements for worksheet "Original Data" (3 Points) All your formula used in your calculation should use meaningful cell names such as =+TotalRevenue - TotalCOGS, please don't use cell reference such as =+E13-E19 unless it is necessary (such as formula for calculating each products revenues and COGS where you need to copy and paste formula using relative addresses). Yes, you need to name these cells yourself first. 1. The total number of units sold in 2008 for these three products are listed as the following: Product A Product B Product 2008 Unit Sold 3000 4500 2300 Please fill out all the yellow boxed cells such as the following according to the requirements below: . 2. The estimated number of unit to be sold for all three products in 2009 over 2008 number should be calculated based on the percentage of increase as specified in Cell D3 which is currently set at 10%. Name the D3 cell as increasePCT. All the calculation required are based on the 2009 forecast target of units to be sold for Product A, B, and C. Calculate the revenues and costs of goods sold (COGS) for each products based on 2009 data. TotalRevenue is the sum of the revenues for all three products for 2009. 3. 4. 5. 6. 7. 8. 9. 10. TotalCOGS is the sum of the COGS for all three products for 2009. Salary is 15% of TotalRevenue (the sum of the revenues for all three products for 2009) GrossProfit = TotalRevenue - TotalCOGS Advertising is 4% of TotalRevenue Miscellaneous expenses are 1% of TotalRevenue OperatingExpense = Salary + Advertising + Miscellaneous expenses EarningBeforeTax = GrossProfit - Operating Expense Calculate the Taxes based on tax rate of 30% against the EarningBeforeTax. Net Profit = EarningBeforeTax- Taxes - = 11. 12. 13. 14. = Home Insert Draw Page Layout Formulas Data Review Share Comments 9. Connections Properties View Tell me 21 17 Le 1 Flash Data Validation HOM y Clear Reapoly Advanced - Analysis Tools i Group o Ungroup Subtotal ill Stocks Get External Data Data from Picture Refresh All Catoncies 1 Sort Filter X1 Fit Links Text to Columns Remove Duplicates Consolidate What Analysis Data Analysis G4 7 0 E F G H K L M N a P A C Excel Homework 2 3 Overal Percentage of Sales Increase in 2009 by Unit Your name: : Section Email Address: Actual Total Points D increasePCT 1 2009 Target Unit Sold 2009 2009 Revenue Costs of Good Sold 2008 Unt Sold 3000 4500 2300 Unit Cost Unit Pro 34000 530.00 $25.00 $50.00 S45.00 $32.CO 0 0 0 Make sure you name all these cells and use it in the formula Max 5 8 Reverus 7 Product A 8 Product B Product C 10 11 2009 Forecast: 12 Total Revenue 13 Total DOGS 14 Gross Pro 15 16 17 Operating Experts 18 SALATLAR 19 Advertising 20 Miscellaneous 21 Total Operating Expen 22 23 Eamirgs Belure Taxes 24 Tancs 25 Net Profit 26 27 28 29 30 31 32 33 34 35 36 37 38 39 40 41 47 43 44 Fal 2016 45 46 47 Actual 0
Step by Step Solution
There are 3 Steps involved in it

Get step-by-step solutions from verified subject matter experts