

Question: please help me i'm really stuck on this whole thing For the questions below, include units if applicable. If necessary, use a separate sheet of
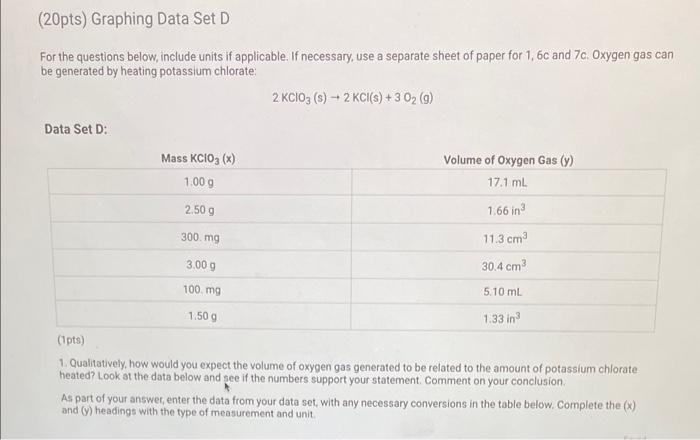
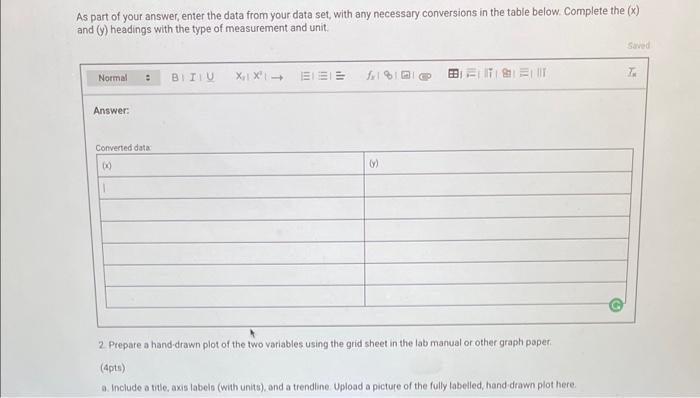
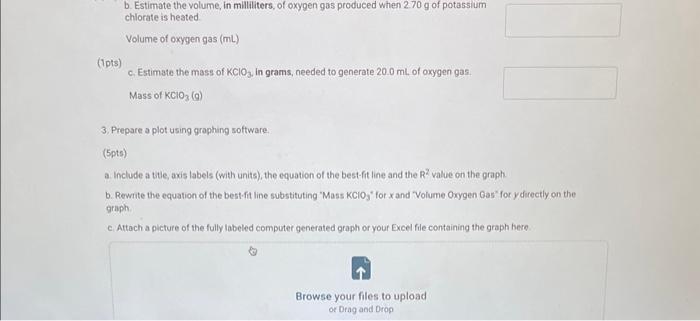
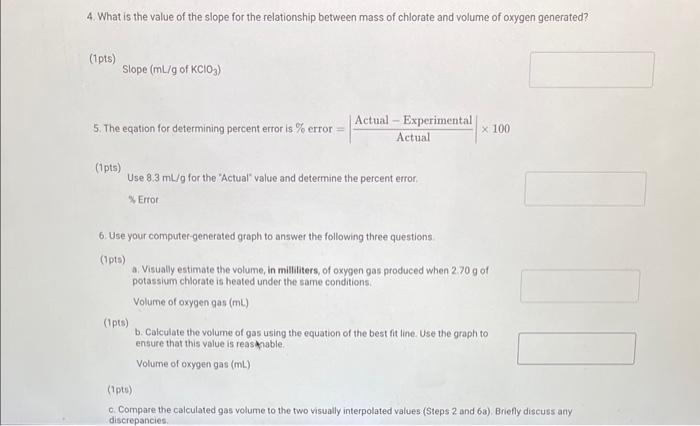
For the questions below, include units if applicable. If necessary, use a separate sheet of paper for 1,6c and 7c. Oxygen gas can be generated by heating potassium chlorate: 2KClO3(s)+2KCl(s)+3O2(g) Data Set D: (1prs) 1. Qualitatively, how would you expect the volume of oxygen gas generated to be related to the amount of potassium chlorate. heated? Look at the data below and see if the numbers support your statement. Comment on your conclusion. As part of your answer, enter the data from your data set, with any necessary conversions in the table below. Complete the ( (x) and (y) headings with the fype of measurement and unit. As part of your answer, enter the data from your data set, with any necessary conversions in the table below. Complete the ( x ) and (y) headings with the type of measurement and unit. Answer: 2. Prepare a hand-drawn plot of the two variables using the grid sheet in the lab manual or other graph paper: (4pts) a. include a tite, axis labelo (with units), and a trendine Upload a picture of the fully labelled, hand drawn plot here. b. Estimate the volume, in mililiters, of oxygen 9a5 produced when 270g of potassium chlorate is heated Volume of oxygen gas (mL) (ipts) c. Estimate the mass of KClO3, in grams, needed to generate 20.0mL, of oxygen gas. Mass of KClO3(g) 3. Prepare a plot using graphing software. (5pts) a. Include a tite, axis labels (with units), the equation of the best-fit line and the R2 value on the graph. b. Rewrite the equation of the best-fit line substituting 'Mass KClO3 ' for x and Volume Oxygen Gas' for y directly on the caraph. c. Attach a picture of the fully labeled computer generated graph or your Excel file containing the graph here. 4. What is the value of the slope for the relationship between mass of chlorate and volume of oxygen generated? (1pts) Slope (mL/g of KClO3) 5. The eqation for determining percent error is \% error =ActualActualExperimental100 (1pts) Use 8.3mL/g for the 'Actual" value and determine the percent error. 5. Ertor 6. Use your computer-generated graph to answer the following three questions. (1pts) a. Visually estimate the volume, in milliliters, of oxygen gas produced when 2.70g of potassium chlorate is heated under the same conditions. Volume of oxygen gas (mL) (1pts) b. Calculate the volume of gas using the equation of the best fit line. Use the graph to ensure that this value is reas thable. Volume of oxygen gas (mL) (1pts) c. Compare the calculated gas volume to the two visually interpolated values (Steps 2 and 63 ), Briefly discuss any 7. Using your computer-generated graph: (1pts) Visually estimate the mass, in grams, of KClO3 needed to generate 20.0mL of oxygen gas. a. Mass of KClO3(g) (1pte) b. Calculate the mass, in grams, of potassium chlorate needed to generate 20.0mL of oxygen gas. Use the graph to ensure that this value is reasonable. Mass of KClO3(g) (1pts) Compare the calculated mass of potassium chlorate to the two visually interpolated values (Steps 2 and 7 ). Briefly discuss any discrepancies. For the questions below, include units if applicable. If necessary, use a separate sheet of paper for 1,6c and 7c. Oxygen gas can be generated by heating potassium chlorate: 2KClO3(s)+2KCl(s)+3O2(g) Data Set D: (1prs) 1. Qualitatively, how would you expect the volume of oxygen gas generated to be related to the amount of potassium chlorate. heated? Look at the data below and see if the numbers support your statement. Comment on your conclusion. As part of your answer, enter the data from your data set, with any necessary conversions in the table below. Complete the ( (x) and (y) headings with the fype of measurement and unit. As part of your answer, enter the data from your data set, with any necessary conversions in the table below. Complete the ( x ) and (y) headings with the type of measurement and unit. Answer: 2. Prepare a hand-drawn plot of the two variables using the grid sheet in the lab manual or other graph paper: (4pts) a. include a tite, axis labelo (with units), and a trendine Upload a picture of the fully labelled, hand drawn plot here. b. Estimate the volume, in mililiters, of oxygen 9a5 produced when 270g of potassium chlorate is heated Volume of oxygen gas (mL) (ipts) c. Estimate the mass of KClO3, in grams, needed to generate 20.0mL, of oxygen gas. Mass of KClO3(g) 3. Prepare a plot using graphing software. (5pts) a. Include a tite, axis labels (with units), the equation of the best-fit line and the R2 value on the graph. b. Rewrite the equation of the best-fit line substituting 'Mass KClO3 ' for x and Volume Oxygen Gas' for y directly on the caraph. c. Attach a picture of the fully labeled computer generated graph or your Excel file containing the graph here. 4. What is the value of the slope for the relationship between mass of chlorate and volume of oxygen generated? (1pts) Slope (mL/g of KClO3) 5. The eqation for determining percent error is \% error =ActualActualExperimental100 (1pts) Use 8.3mL/g for the 'Actual" value and determine the percent error. 5. Ertor 6. Use your computer-generated graph to answer the following three questions. (1pts) a. Visually estimate the volume, in milliliters, of oxygen gas produced when 2.70g of potassium chlorate is heated under the same conditions. Volume of oxygen gas (mL) (1pts) b. Calculate the volume of gas using the equation of the best fit line. Use the graph to ensure that this value is reas thable. Volume of oxygen gas (mL) (1pts) c. Compare the calculated gas volume to the two visually interpolated values (Steps 2 and 63 ), Briefly discuss any 7. Using your computer-generated graph: (1pts) Visually estimate the mass, in grams, of KClO3 needed to generate 20.0mL of oxygen gas. a. Mass of KClO3(g) (1pte) b. Calculate the mass, in grams, of potassium chlorate needed to generate 20.0mL of oxygen gas. Use the graph to ensure that this value is reasonable. Mass of KClO3(g) (1pts) Compare the calculated mass of potassium chlorate to the two visually interpolated values (Steps 2 and 7 ). Briefly discuss any discrepancies
Step by Step Solution
There are 3 Steps involved in it

Get step-by-step solutions from verified subject matter experts