

Question: please help me in answering Q:1. by writing a code using Juypter Notebooks. the histogram i have displayed is not correct and I am stuck
please help me in answering Q:1. by writing a code using Juypter Notebooks. the histogram i have displayed is not correct and I am stuck :/
the table data is correctly displayed though.
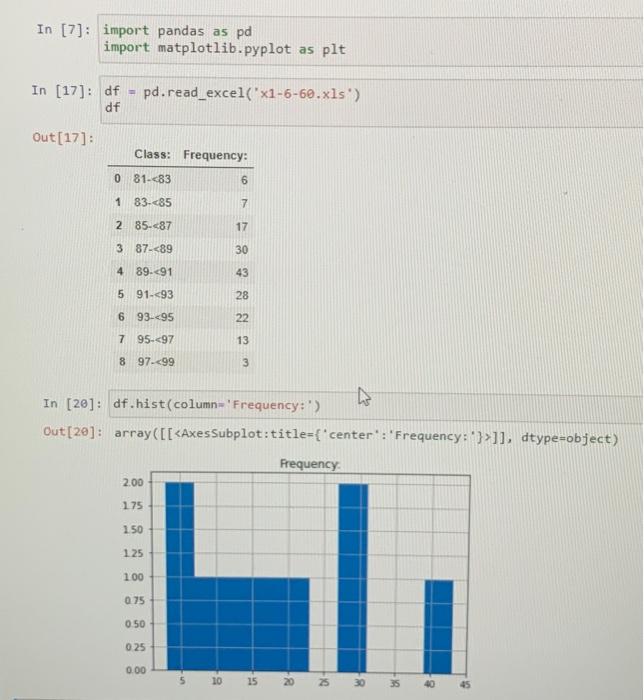
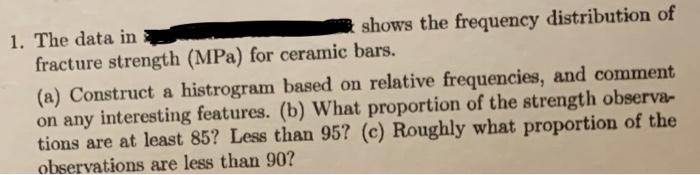
In [7]; import pandas as pd import matplotlib.pyplot as plt In [17]: df - df pd.read_excel('x1-6-60.xls) Out[17]: Class: Frequency: 081-83 6 1 83-85 7 2 85-87 17 3 87-89 30 4 89.91 43 5 91.]], dtype=object) Frequency 2.00 175 150 125 100 0.75 050 025 0.00 $ 10 15 20 25 10 1. The data in shows the frequency distribution of fracture strength (MPa) for ceramic bars. (a) Construct a histrogram based on relative frequencies, and comment on any interesting features. (b) What proportion of the strength observa- tions are at least 85? Less than 95? (c) Roughly what proportion of the observations are less than 90
Step by Step Solution
There are 3 Steps involved in it
1 Expert Approved Answer
Step: 1 Unlock

Question Has Been Solved by an Expert!
Get step-by-step solutions from verified subject matter experts
Step: 2 Unlock
Step: 3 Unlock