

Question: Please help me in my task about hypothesis testingSubject: Stats and ProbA. Collection of DataSTATISTICS AND PROBABILITY ASSESSMENT REPORT FORMCONTENTS1. For the data, the students
Please help me in my task about hypothesis testingSubject: Stats and ProbA. Collection of DataSTATISTICS AND PROBABILITY ASSESSMENT REPORT FORMCONTENTS1. For the data, the students will be given a data from a research.2. The data will be process through the Excel ToolPak.3. Present only the table result from the ToolPak from Part I to Part III.Part I - One-Sample Hypothesis Testing (10 points)Given the values in the data, check if the sample data truly represents the population data at 5% level of significance using hypothesis testing in one variable.a. Construct the null and alternative hypothesis.b. Use the MS Excel Data Analysis Toolpak to compute the p-value.c. Decide from the p- value and significance level.Guide Questions (5 points)1. Using the given and computed values, is there a reason to believe that there is no significant difference between sample data and population data? Justify.2. What if the significance level is raised to 10%, will there be a change on the original conclusion? Justify.Part II - Two-Sample Hypothesis Testing (10 points)Given the values, check if there is a significant difference between the 1st and 2nd variables of height and weight at 10% level of significance using hypothesis testing in two variables.a. Construct the null and alternative hypothesis.b. Use the MS Excel Data Analysis Toolpak to compute the p-value.c. Decide from the p- value and significance level.Guide Questions (5 points)1. Using the given and computed values, is there a reason to believe that there no significant difference between the weight of male and female students of 11 STEM 24.? Justify.2. What if the significance level is raised to 20%, will there be a change on the original conclusion? Justify.Part III - Correlation (10 points)Given the values, check if there is a relationship between the height and weight of 11 STEM 24 students. Use the MS Excel Data Analysis Toolpak to compute the correlation coefficient.Guide Question (5 points)Using the computed value, what can you say about the relationship between the height and weight of 11 STEM 24 students? Justify.USE THE FOLLOWING DATA BELOW FOR YOUR DATA REFERENCE.From 45 students of Grade 11 Stem 24, their average weight is 48 kg and an average height of 153 cm. 25 randomly selected students are taken from the group. (The data are as follows)

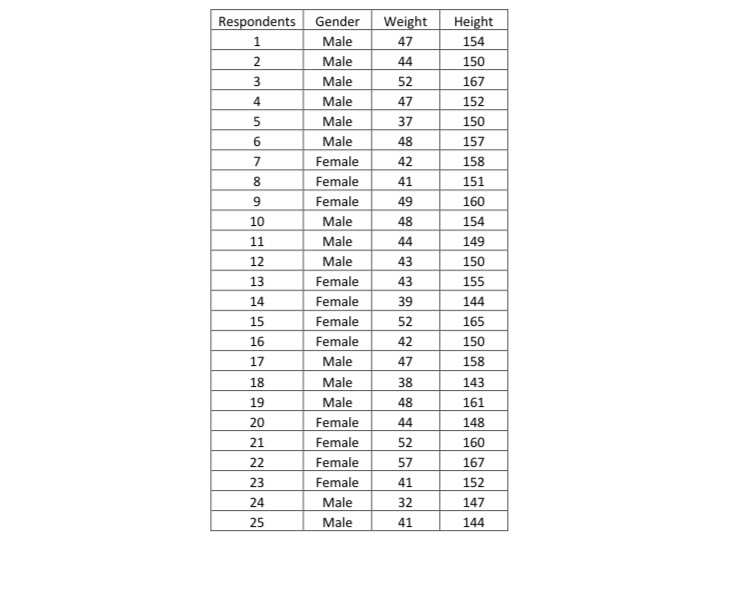
Respondents Gender Weight Height 1 Male 47 154 N Male 44 150 3 Male 52 167 Male 47 152 5 Male 37 150 6 Male 48 157 Female 42 158 Female 41 151 9 Female 49 160 10 Male 48 154 11 Male 44 149 12 Male 43 150 13 Female 43 155 14 Female 39 144 15 Female 52 165 16 Female 42 150 17 Male 47 158 18 Male 38 143 19 Male 48 161 20 Female 44 148 21 Female 52 160 22 Female 57 167 23 Female 41 152 24 Male 32 147 25 Male 41 144
Step by Step Solution
There are 3 Steps involved in it

Get step-by-step solutions from verified subject matter experts