Question: please help me make it simple af use a calculator Table A # of drivers that can expect to be searched % of drivers with
please help me make it simple af use a calculator
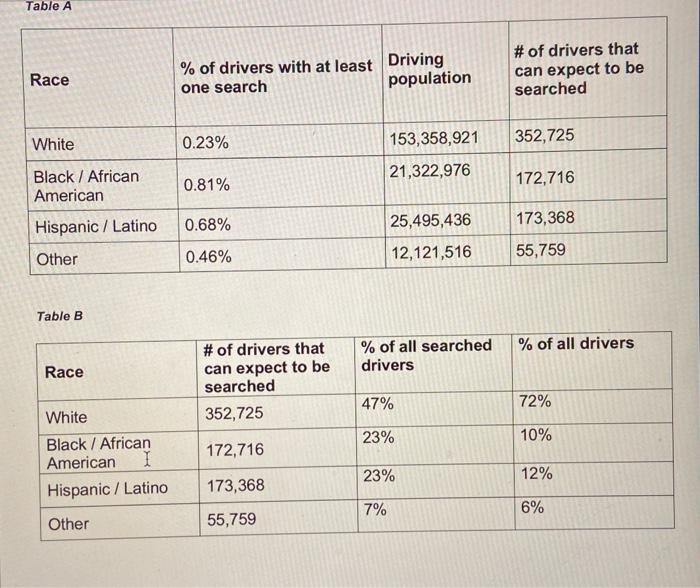
Table A # of drivers that can expect to be searched % of drivers with at least Driving one search population Race White 0.23% 352,725 153,358,921 21,322,976 Black / African American 0.81% 172,716 0.68% Hispanic / Latino 25,495,436 173,368 Other 0.46% 12,121,516 55,759 Table B % of all drivers % of all searched drivers Race # of drivers that can expect to be searched 352,725 47% 72% 10% White Black / African American I Hispanic / Latino 172,716 23% 12% 173,368 7% 6% Other 55,759 Activity 8: Hypothesis testing and confidence intervals Now it's time to make some connections to the inferential statistical methods that we've learned. Consider the following questions: How could the hypotheses be set up? Is there more than one type of test that we could use? What parameter would we test? What data would we use to formulate a null hypothesis? What are we trying to show? What data could we use to calculate our test statistic? Examine the data in tables A & B above and then perform an appropriate hypothesis test numbering each step using the data in tables. Then, construct a 1-a confidence interval. Step 1: I Table A # of drivers that can expect to be searched % of drivers with at least Driving one search population Race White 0.23% 352,725 153,358,921 21,322,976 Black / African American 0.81% 172,716 0.68% Hispanic / Latino 25,495,436 173,368 Other 0.46% 12,121,516 55,759 Table B % of all drivers % of all searched drivers Race # of drivers that can expect to be searched 352,725 47% 72% 10% White Black / African American I Hispanic / Latino 172,716 23% 12% 173,368 7% 6% Other 55,759 Activity 8: Hypothesis testing and confidence intervals Now it's time to make some connections to the inferential statistical methods that we've learned. Consider the following questions: How could the hypotheses be set up? Is there more than one type of test that we could use? What parameter would we test? What data would we use to formulate a null hypothesis? What are we trying to show? What data could we use to calculate our test statistic? Examine the data in tables A & B above and then perform an appropriate hypothesis test numbering each step using the data in tables. Then, construct a 1-a confidence interval. Step 1