

Question: please help me on this!! and please show on excel. it doesnt make sense when just on paper and typed out. please show on excel!!
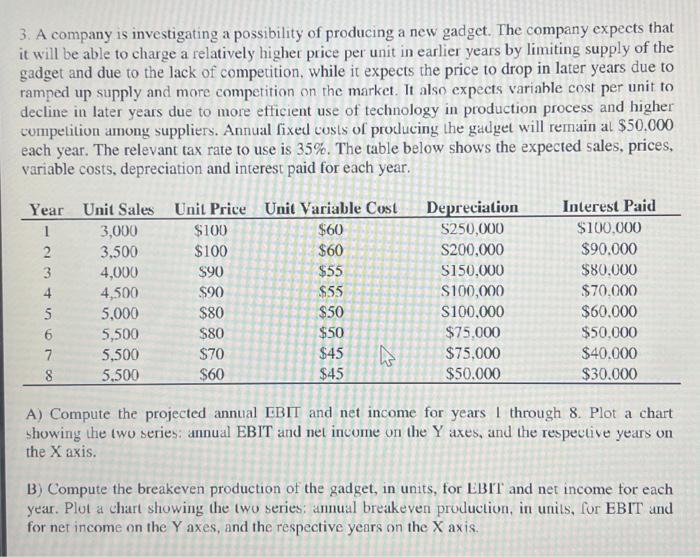
3. A company is investigating a possibility of producing a new gadget. The company expects that it will be able to charge a relatively higher price per unit in earlier years by limiting supply of the gadget and due to the lack of competition, while it expects the price to drop in later years due to ramped up supply and more competition on the market. It also expects variable cost per unit to decline in later years due to more efficient use of technology in production process and higher competition among suppliers. Annual fixed costs of producing the gadget will remain al $50.000 each year. The relevant tax rate to use is 35%. The table below shows the expected sales, prices, variable costs, depreciation and interest paid for each year. A) Compute the projected annual EBII and net income for years 1 through 8 . Plot a chart showing the two series: annual EBIT and net income on the Y axes, and the respective years on the X axis. B) Compute the breakeven production of the gadget, in units, for LBII and net income for each year. Plot a chart showing the two series: annual breakeven production, in units, for EBIT and for net income on the Y axes, and the respective years on the X axis
Step by Step Solution
There are 3 Steps involved in it

Get step-by-step solutions from verified subject matter experts