

Question: please help me on this following graphs>. Midterm Grades . 25 20 15- 10 5. ._ I A I C D F Grades Frequency
- please help me on this following graphs>.
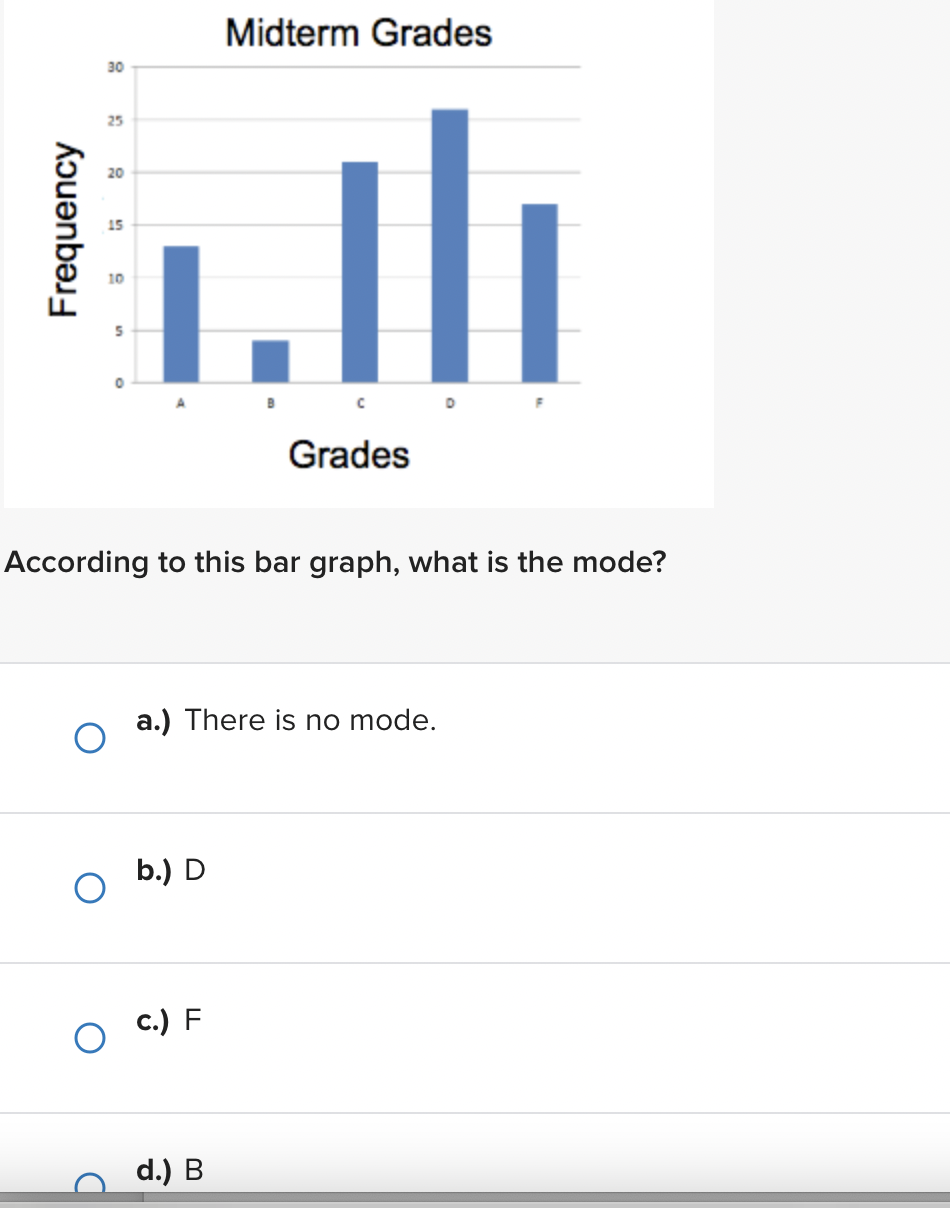
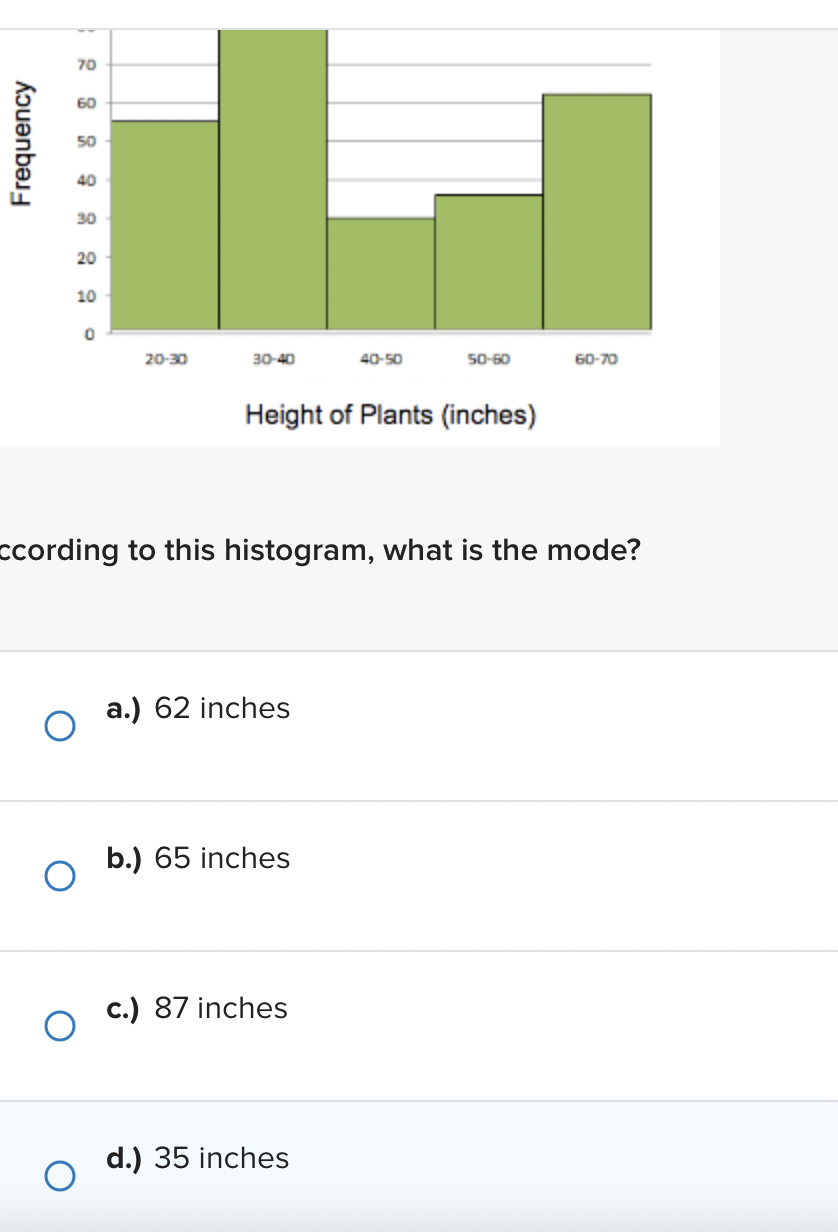
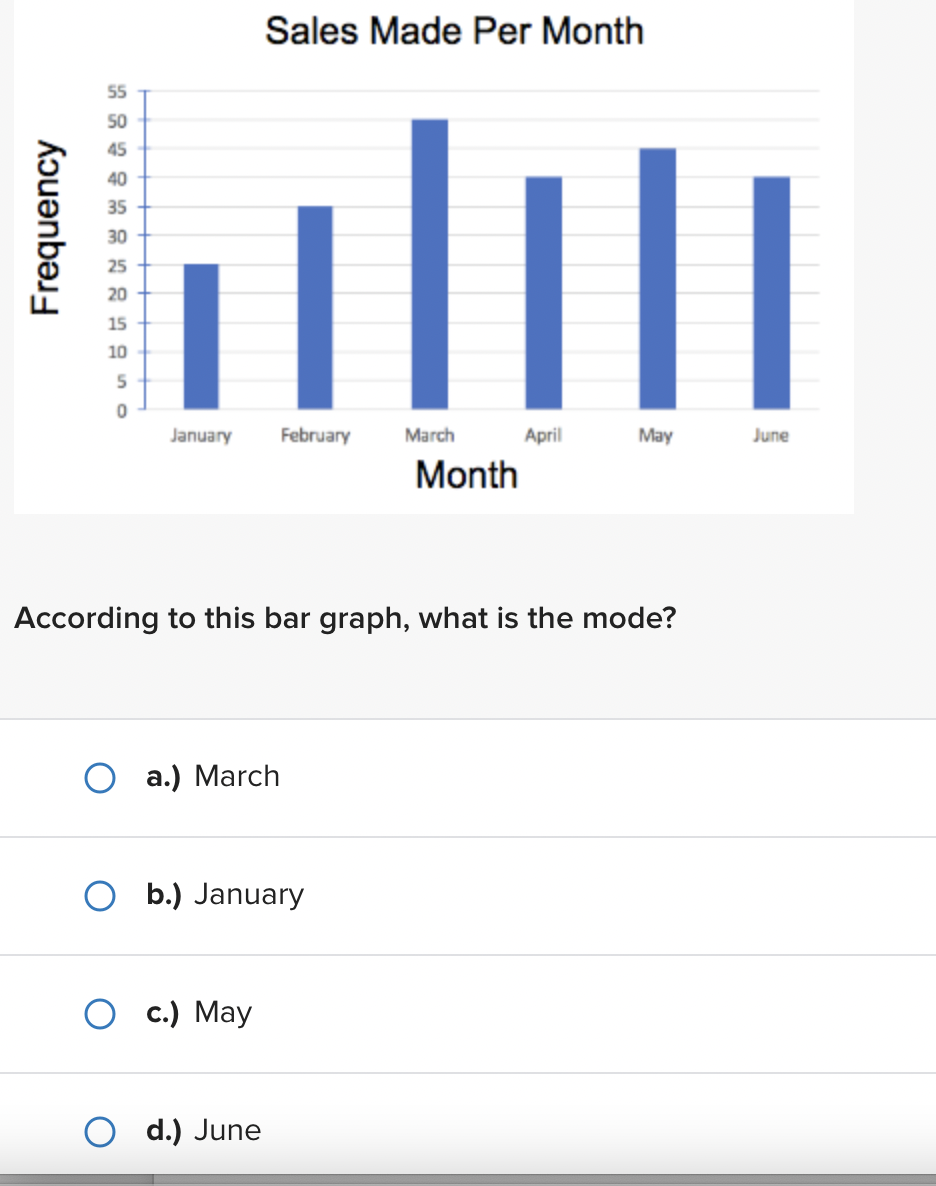
Midterm Grades \" . 25 20 15- 10 5. ._ I A I C D F Grades Frequency According to this bar graph, what is the mode? 0 a.) There is no mode. 0 b.)D O c.) F O d.)B 70 Frequency 20 10 0 20-30 30-40 40-50 50-60 60-70 Height of Plants (inches) ccording to this histogram, what is the mode? ( a.) 62 inches b.) 65 inches ( c.) 87 inches ( d.) 35 inchesSales Made Per Month Frequency January February March April May June Month According to this bar graph, what is the mode? O a.) March O b.) January O c.) May O d.) June
Step by Step Solution
There are 3 Steps involved in it
1 Expert Approved Answer
Step: 1 Unlock

Question Has Been Solved by an Expert!
Get step-by-step solutions from verified subject matter experts
Step: 2 Unlock
Step: 3 Unlock