

Question: Please help me out for this problem Table A: Standardized z-score chart for positive z-scores STANDARD STATISTICAL TABLES 1. Areas under the Normal Distribution The
Please help me out for this problem
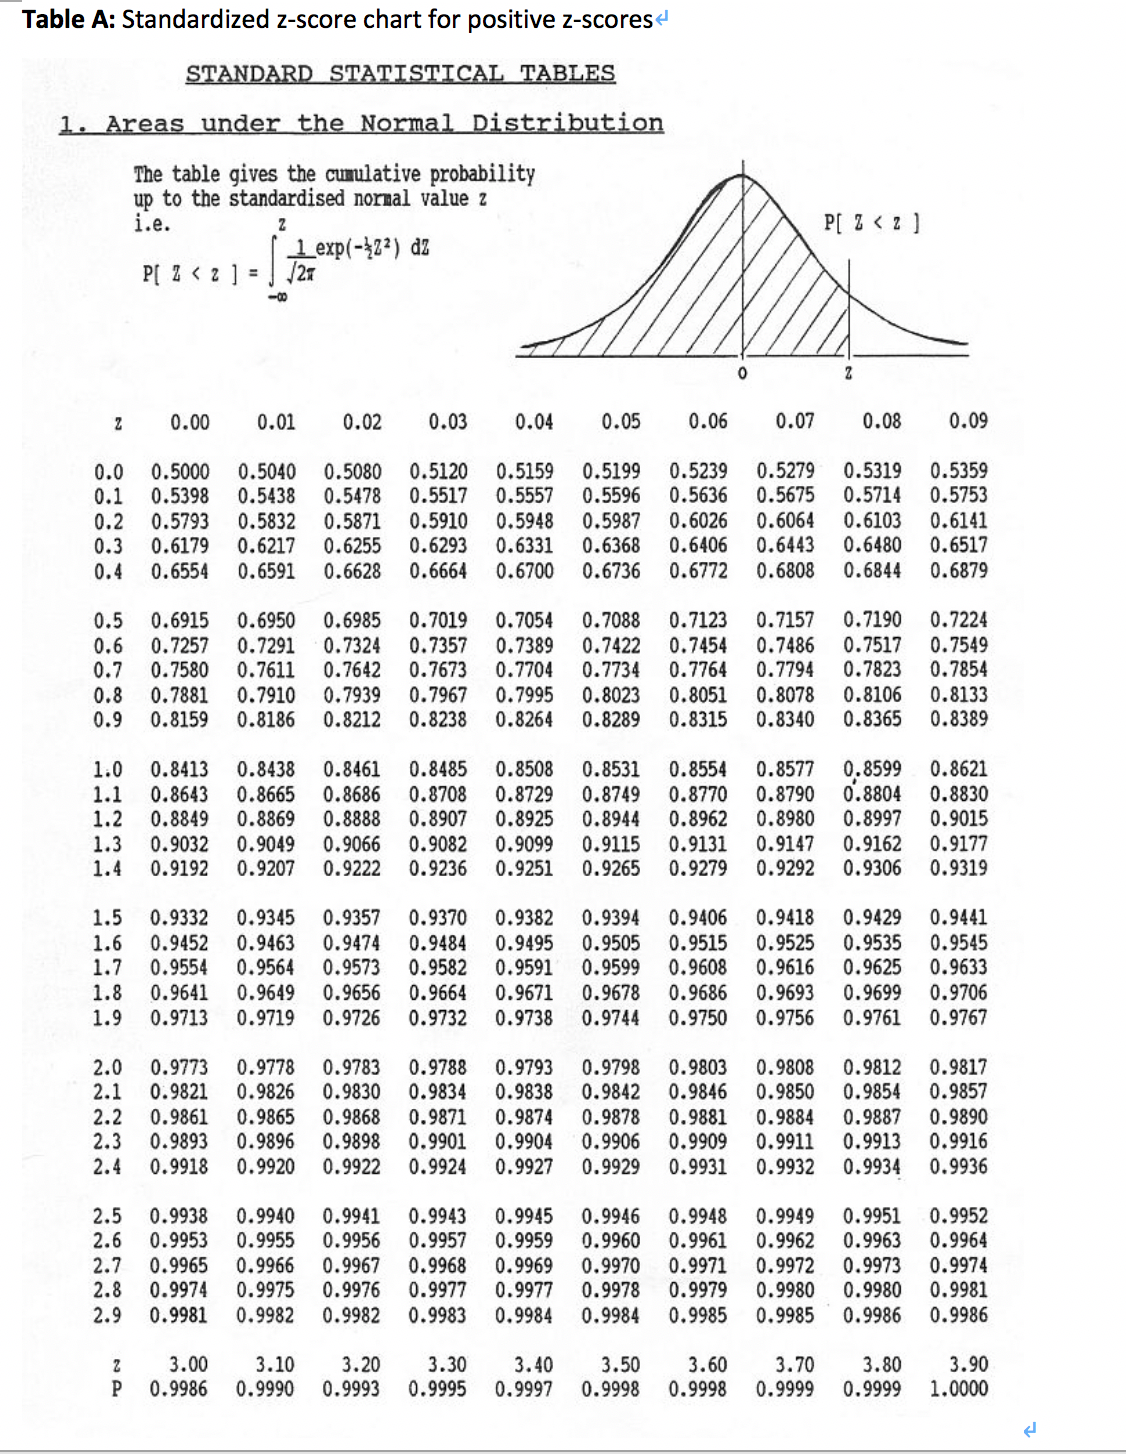
Table A: Standardized z-score chart for positive z-scores STANDARD STATISTICAL TABLES 1. Areas under the Normal Distribution The table gives the cumulative probability up to the standardised normal value z i.e. P[ Z 2 or
Step by Step Solution
There are 3 Steps involved in it
1 Expert Approved Answer
Step: 1 Unlock

Question Has Been Solved by an Expert!
Get step-by-step solutions from verified subject matter experts
Step: 2 Unlock
Step: 3 Unlock