

Question: please help me out with these two questions Note: The valuation for 2021E is the same in the detailed calculation (cells G60 and M48) and
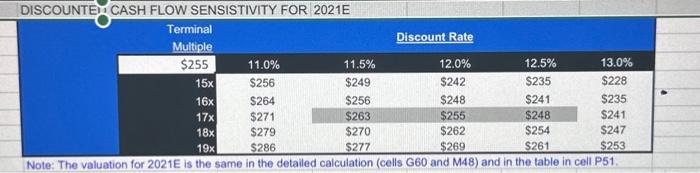
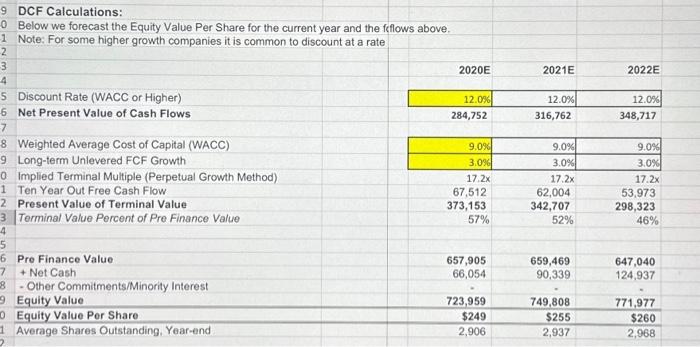
Note: The valuation for 2021E is the same in the detailed calculation (cells G60 and M48) and in the table in cell P51 5) Let's consider sensitivity analysis using the What if capabilities of Excel's Data Table functionality. Note the Data Table in L45 of the Discounted Cash Flow in SFAM. The Data Table varies the assumptions we used for the Discount Rate (row 4 S in SFAM) and the implied Terminal Multiple (row 50 in SFAM). What is the greatest upside potential for the shares given the values in the Data Table? DCF Calculations: Below we forecast the Equity Value Per Share for the current year and the ffflows above. Note: For some higher growth companies it is common to discount at a rate \begin{tabular}{|c|c|c|c|} \hline & 2020E & 2021E & 2022E \\ \hline Discount Rate (WACC or Higher) & 12.0% & 12.0% & 12.0% \\ \hline Net Present Value of Cash Flows & 284,752 & 316,762 & 348,717 \\ \hline Weighted Average Cost of Capital (WACC) & 9.0% & 9.0% & 9.0% \\ \hline Long-term Unlevered FCF Growth & 3.096 & 3.0% & 3.0% \\ \hline Implied Terminal Multiple (Perpetual Growth Method) & 17.2x & 17.2x & 17.2x \\ \hline Ten Year Out Free Cash Flow & 67,512 & 62,004 & 53,973 \\ \hline Present Value of Terminal Value & 373,153 & 342,707 & 298,323 \\ \hline Terminal Value Percent of Pre Finance Value & 57% & 52% & 46% \\ \hline & & & \\ \hline Pre Finance Value & 657,905 & 659,469 & 647,040 \\ \hline+ Net Cash & 66,054 & 90,339 & 124,937 \\ \hline - Other Commitments/Minority Interest & . & . & 1 \\ \hline Equity Value & 723,959 & 749,808 & 771,977 \\ \hline Equity Value Per Share & $249 & $255 & $260 \\ \hline Average Shares Outstanding, Year-end & 2,906 & 2,937 & 2,968 \\ \hline \end{tabular}
Step by Step Solution
There are 3 Steps involved in it

Get step-by-step solutions from verified subject matter experts