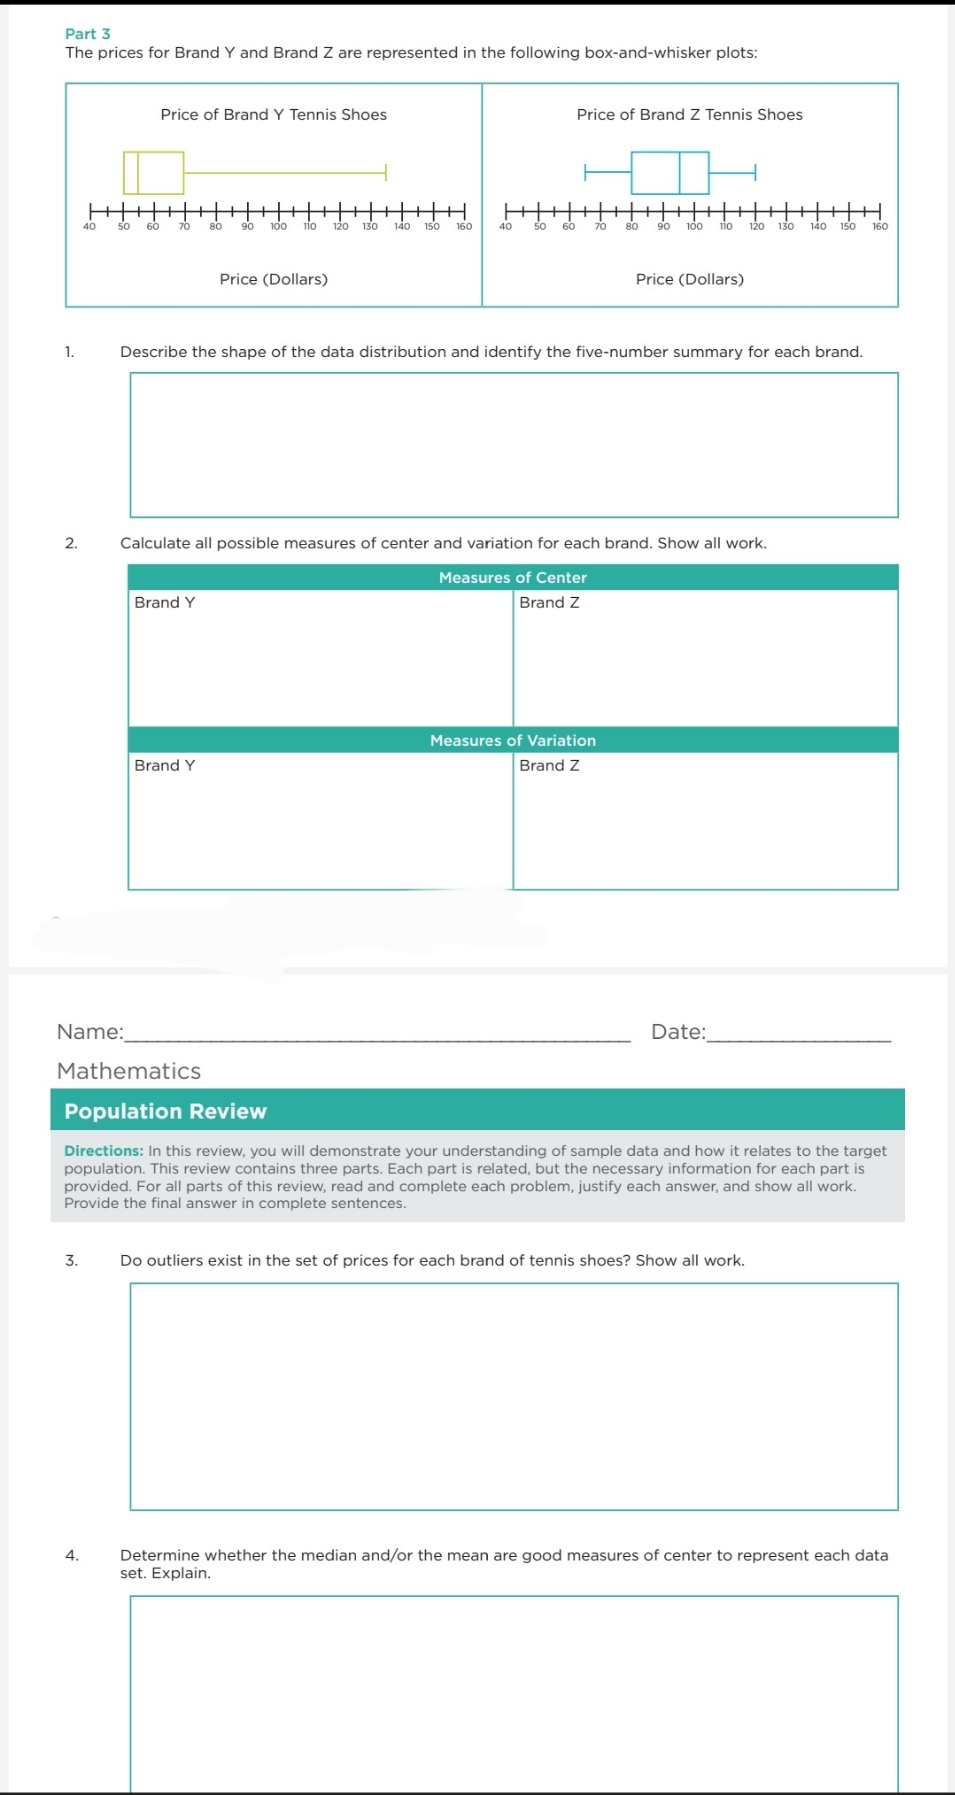
Question: please help me out with this Part 3 The prices for Brand Y and Brand 2 are represented in the following box-and-whisker plots: Price of

please help me out with this

please help me out with this Part 3 The prices
Part 3 The prices for Brand Y and Brand 2 are represented in the following box-and-whisker plots: Price of Brand Y Tennis Shoes Price of Brand Z Tennis Shoes l|:|:|i 12o IsD Me 150 ion Price (Dollars) Price (Dollars) 1. Describe the shape of the data distribution and identify the five-number summary for each brand. 2. Calculate all possible measures of center and variation for each brand. Show all work. Measures of Center Brand 2 Measures of VariatIon Name: Date: Mathematics Population Review Directions: In this review. you will demonstrate your understanding of sample data and how it relates to the target population. This review contains three parts. Each part ls related. but the necessaryI information for each part Is provided. For all parts of this review, read and complete each problem. iustlfy each answer. and show all work. Provide the nal answer in complete sentences. Do outliers exist in the set of prices for each brand of tennis shoes? Show all work. Q 4. Determine whether the median andfor the mean are good measures of center to represent each data set. Explain

Step by Step Solution

There are 3 Steps involved in it

1 Expert Approved Answer
Step: 1 Unlock blur-text-image
Question Has Been Solved by an Expert!

Get step-by-step solutions from verified subject matter experts

Step: 2 Unlock
Step: 3 Unlock

Students Have Also Explored These Related Mathematics Questions!