

Question: Please help me. Really need an expert to help. (P.S. I really don't know how to do it and my assignment is going to be
Please help me. Really need an expert to help. (P.S. I really don't know how to do it and my assignment is going to be due soon!!!)
How to do reformulation of Balance Sheet, Cash Flow Statement, Income Statement, and Statement of Shareholders Equity of APPLE INC from the year 2016 to 2021? The subject is FIN324. Thanks.
Thanks a lot and I would really appreciate your help.
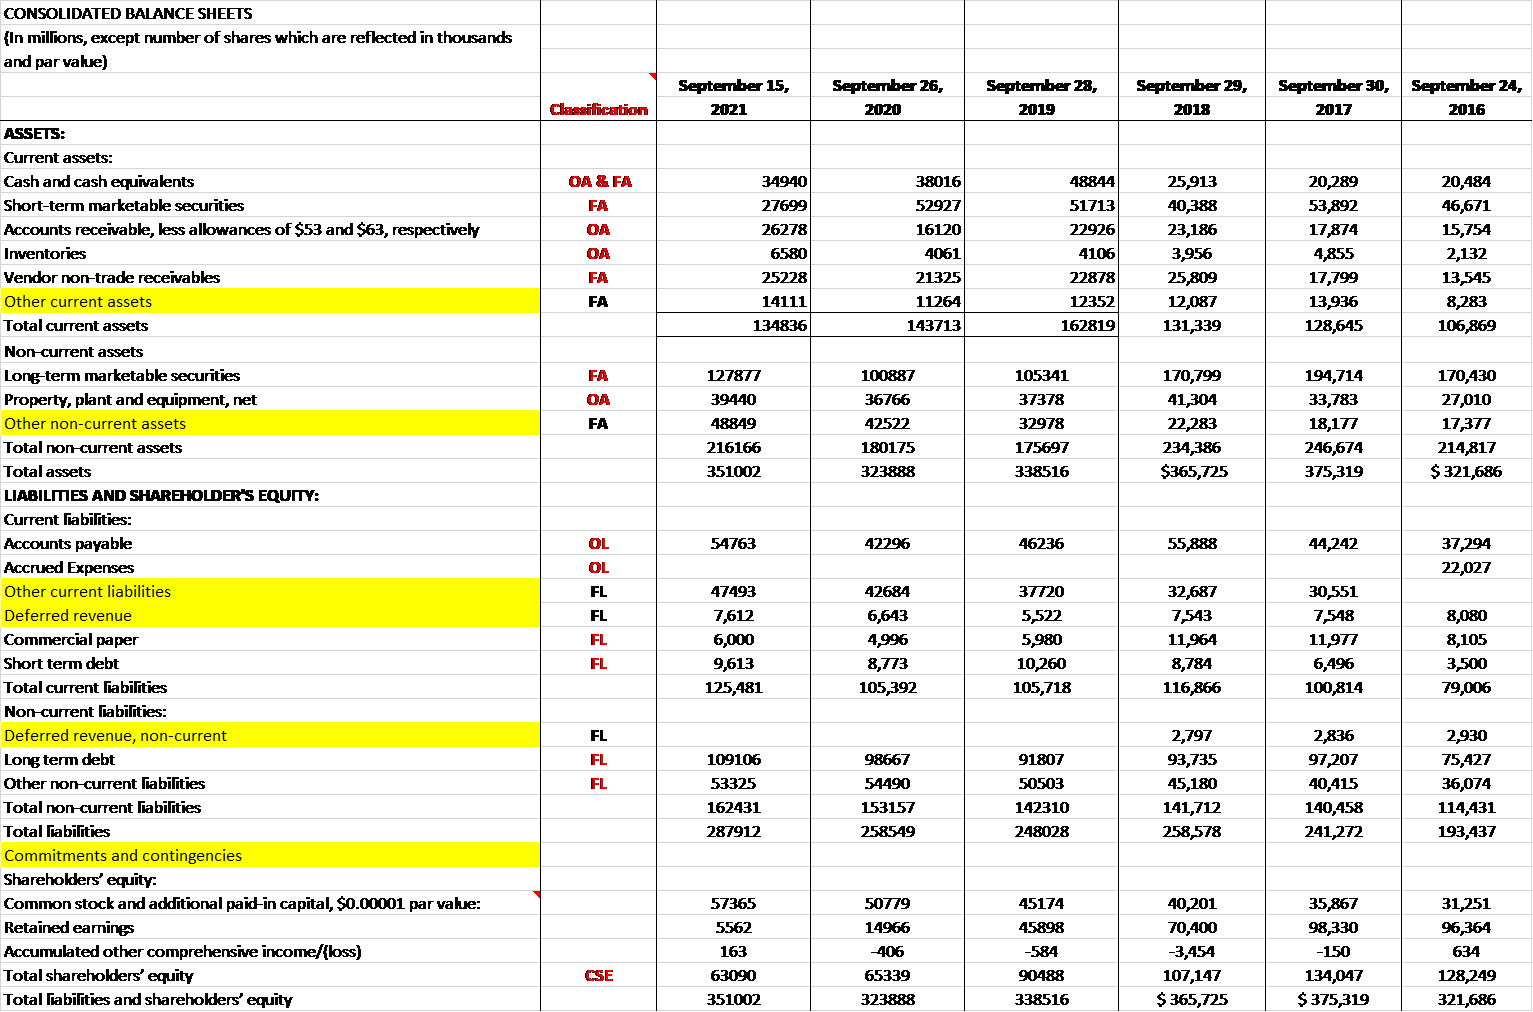
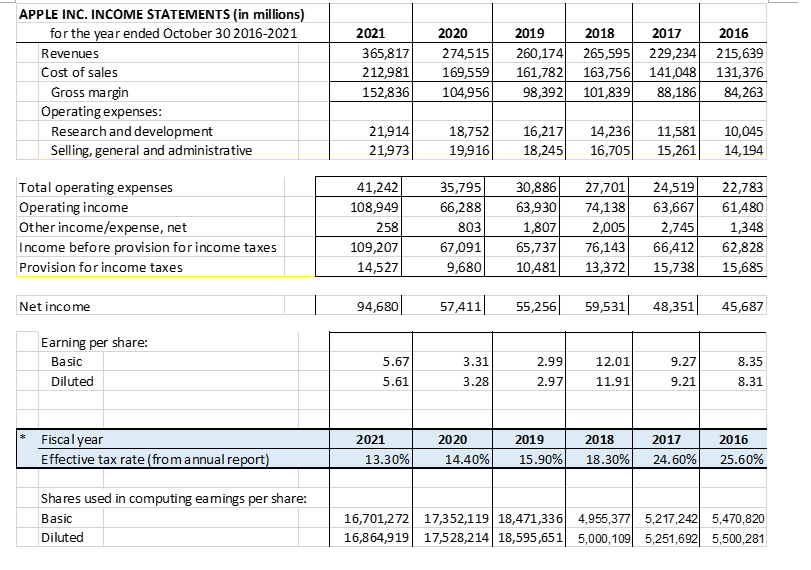
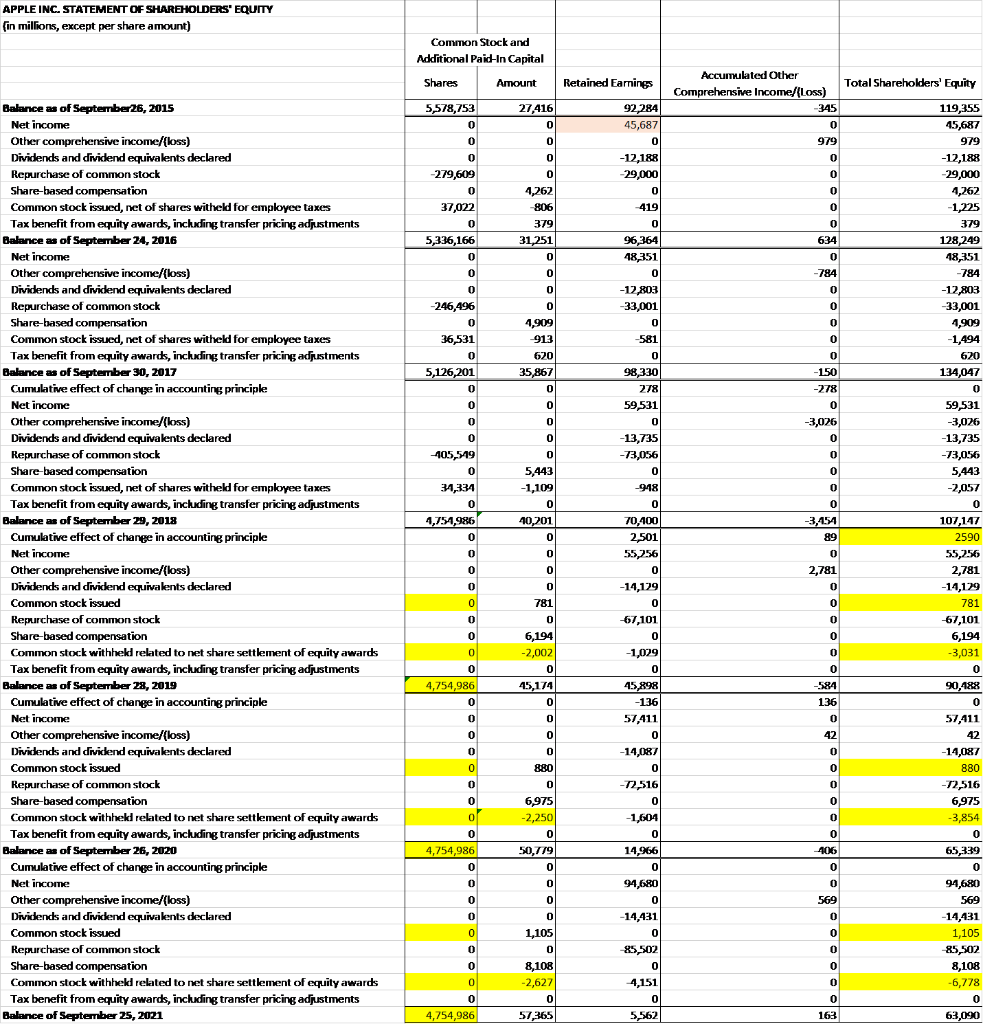
Financial statements are provided below,

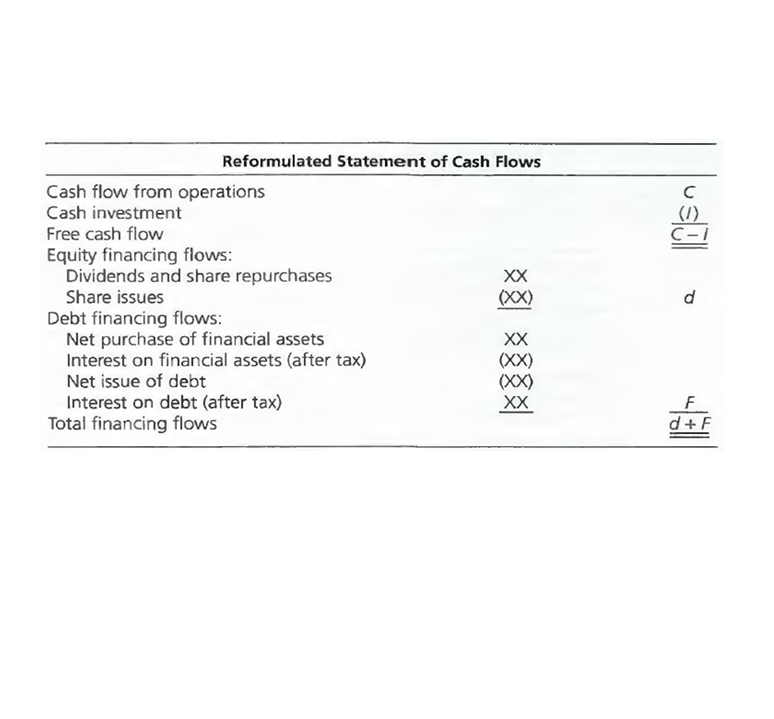
 Below will be the format for reformulated cash flow statement,
Once again, thanks a lot for your help.
CONSOLIDATED BALANCE SHEETS {In millions, except number of shares which are reflected in thousands and par value) ASSETS: Current assets: Cash and cash equivalents Short-term marketable securities Accounts receivable, less allowances of $53 and $63, respectively Inventories Vendor non-trade receivables Other current assets Total current assets Non-current assets Long-term marketable securities Property, plant and equipment, net Other non-current assets Total non-current assets Total assets LIABILITIES AND SHAREHOLDER'S EQUITY: Current liabilities: Accounts payable Accrued Expenses Other current liabilities Deferred revenue Commercial paper Short term debt Total current liabilities Non-current liabilities: Deferred revenue, non-current Long term debt Other non-current liabilities Total non-current liabilities Total liabilities Commitments and contingencies Shareholders' equity: Common stock and additional paid-in capital, $0.00001 par value: Retained earnings Accumulated other comprehensive income/{loss) Total shareholders' equity Total liabilities and shareholders' equity Classification OA & FA FA OA OA FA FA FA OA FA FFFF99 OL OL FL FL FL IFL FL FL FL CSE September 15, 2021 34940 27699 26278 6580 25228 14111 134836 127877 39440 48849 216166 351002 54763 47493 7,612 6,000 9,613 125,481 109106 53325 162431 287912 57365 5562 163 63090 351002 September 26, 2020 38016 52927 16120 4061 21325 11264 143713 100887 36766 42522 180175 323888 42296 42684 6,643 4,996 8,773 105,392 98667 54490 153157 258549 50779 14966 -406 65339 323888 September 28, 2019 48844 51713 22926 4106 22878 12352 162819 105341 37378 32978 175697 338516 46236 37720 5,522 5,980 10,260 105,718 91807 50503 142310 248028 45174 45898 -584 90488 338516 September 29, 2018 25,913 40,388 23,186 3,956 25,809 12,087 131,339 170,799 41,304 22,283 234,386 $365,725 55,888 32,687 7,543 11,964 8,784 116,866 2,797 93,735 45,180 141,712 258,578 40,201 70,400 -3,454 107,147 $365,725 September 30, September 24, 2017 2016 20,289 20,484 53,892 46,671 17,874 15,754 4,855 2,132 17,799 13,545 13,936 8,283 128,645 106,869 194,714 170,430 33,783 27,010 18,177 17,377 246,674 214,817 375,319 $ 321,686 44,242 37,294 22,027 30,551 7,548 8,080 11,977 8,105 6,496 3,500 100,814 79,006 2,836 2,930 97,207 75,427 40,415 36,074 140,458 114,431 241,272 193,437 35,867 31,251 98,330 96,364 -1.50 134,047 634 128,249 $ 375,319 321,686 CONSOLIDATED STATEMENTS OF CASH FLOWS (In millions) Cash and cash equivalents, beginning of the year Operating activities: Net income Adjustments to reconcile net income to cash generated by operating activities: Depreciation and amortization Share-based compensation expense Deferred income tax expense/(benefit) Other Changes in operating assets and liabilities: Accounts receivable, net Inventories Vendor non-trade receivables Other current and non-current assets Accounts payable Deferred revenue Other current and non-current liabilities Cash generated by operating activities Investing activities: Purchases of marketable securities Proceeds from maturities of marketable securities Proceeds from sales of marketable securities Payment for acquisition of property, plant and equipment Payments made in connection with business acquisitions, net Purchases of non-marketable securities Proceeds from non-marketable securities Other Cash generated by investing activities Financing activities: Proceeds from issuance of common stock Payments for taxes related to net share settlement of equity awards Payments for dividends and dividend equivalents Repurchases of common stock Repayments of term debt Change in commercial paper, net Other Cash generated by financing activities Increase/{Decrease) in cash and cash equivalents Cash and cash equivalents, end of the year Supplemental cash flow disclosure: Cash paid for income taxes, net Cash paid for interest September 15, September 26, September 28, September 29, September 30, September 24, 2021 2020 2019 2018 2017 2016 39789 50224 25913 20,289 20,484 21,120 94680 57411 55256 59,531 48,351 45,687 11284 11056 12547 10,903 10,157 10,505 7906 6829 6068 5,340 4,840 4,210 -4774 -215 -340 -32,590 5,966 4,938 -147 -97 -652 -444 -166 486 -10125 6917 245 -5,322 -2,093 527 -2642 -127 -289 828 -2,723 217 -3903 1553 2931 -8,010 -4,254 -51 -8042 -9588 873 -423 -5,318 1,055 12326 -4062 -1923 9,175 8,966 2,117 1676 2081 -625 44 -626 -1,554 5799 8916 -4700 38,490 1,125 -1,906 104038 80674 69391 77,434 64,225 66,231 -109558 -114938 -39630 -71,356 -1.59,486 -142,428 59023 69918 40102 55,881 31,775 21,258 47460 50473 56988 47,838 94,564 90,536 -11085 -7309 -10495 -13,313 -12,451 -12,734 -33 -1524 -624 -721 -329 -297 -131 -210 -1001 -1,871 -521 -1,388 387 92 1634 353 126 -608 -791 -1078 -745 -124 -924 -14545 -4289 45896 16,066 -46,446 -45,977 1105 880 781 669 555 495 -6556 -3634 -2817 -2,527 -1,874 -1,570 -14467 -14081 -14119 -13,712 -12,769 -12,150 -85971 -72358 -66897 -72,738 -32,900 -29,722 20393 16091 6963 6,969 28,662 24,954 -8750 -12629 -8805 -6,500 -3,500 -2,500 1022 -963 -5977 -37 3,852 -397 -129 -126 -105 -93353 -86820 -90976 -87,876 -17,974 -20,890 -3860 -10435 24311 5,624 -195 --636 35929 39789 50224 25,913 20,289 20,484 25385 9501 15263 10,417 11,591 10,444 2687 3002 3423 3,022 2,092 1,316 APPLE INC. INCOME STATEMENTS (in millions) for the year ended October 30 2016-2021 Revenues Cost of sales Gross margin Operating expenses: Research and development Selling, general and administrative Total operating expenses Operating income Other income/expense, net Income before provision for income taxes Provision for income taxes Net income Earning per share: Basic Diluted Fiscal year Effective tax rate (from annual report) Shares used in computing eamings per share: Basic Diluted 2021 2020 2019 2018 2017 260,174 265,595 229,234 365,817 274,515 212,981 169,559 161,782 163,756 141,048 152,836 104,956 98,392 101,839 88,186 21,914 18,752 16,217 14,236 11,581 21,973 19,916 18,245 16,705 15,261 30,886 27,701 24,519 63,930 74,138 63,667 1,807 2,005 2,745 65,737 76,143 66,412 10,481 13,372 15,738 55,256 59,531 48,351 2.99 12.01 9.27 2.97 11.91 9.21 41,242 108,949 258 109,207 14,527 94,680 5.67 5.61 35,795 66,288 803 67,091 9,680 57,411 2021 3.31 3.28 2016 215,639 131,376 84,263 10,045 14,194 22,783 61,480 1,348 62,828 15,685 45,687 8.35 8.31 2020 2019 2018 2017 2016 13.30% 14.40% 15.90% 18.30% 24.60% 25.60% 16,701,272 17,352,119 18,471,336 4,955,377 5,217,242 5,470,820 16,864,919 17,528,214 18,595,651 5,000,109 5,251,692 5,500,281 APPLE INC.STATEMENT OF SHAREHOLDERS' EQUITY (in millions, except per share amount) Balance as of September 26, 2015 Net income Other comprehensive income/{loss) Dividends and dividend equivalents declared Repurchase of common stock Share-based compensation Common stock issued, net of shares witheld for employee taxes Tax benefit from equity awards, including transfer pricing adjustments Balance as of September 24, 2016 Net income Other comprehensive income/(loss) Dividends and dividend equivalents declared Repurchase of common stock Share-based compensation Common stock issued, net of shares witheld for employee taxes Tax benefit from equity awards, including transfer pricing adjustments Balance as of September 30, 2017 Cumulative effect of change in accounting principle Net income Other comprehensive income/{loss) Dividends and dividend equivalents declared Repurchase of common stock Share-based compensation Common stock issued, net of shares witheld for employee taxes Tax benefit from equity awards, including transfer pricing adjustments Balance as of September 29, 2018 Cumulative effect of change in accounting principle Net income Come Other comprehensive income/(loss) Dividends and dividend equivalents declared Common stock issued Repurchase of common stock Share-based compensation Common stock withheld related to net share settlement of equity awards Tax benefit from equity awards, including transfer pricing adjustments Balance as of September 28, 2019 Cumulative effect of change in accounting principle Mat Tam Net income Other comprehensive income/(loss) Dividends and dividend equivalents declared Common stock issued Repurchase of common stock Share-based compensation Common stock withheld related to net share settlement of equity awards Tax benefit from equity awards, including transfer pricing adjustments Balance as of September 26, 2020 Cumulative effect of change in accounting principle Net income Other comprehensive income/{loss) Dividends and dividend equivalents declared Common stock issued Repurchase of common stock Share-based compensation Common stock withheld related to net share settlement of equity awards Tax benefit from equity awards, including transfer pricing adjustments Balance of September 25, 2021 Common Stock and Additional Paid-In Capital Shares Amount 27,416 5,578,753 0 0 0 0 0 0 -279,609 0 4,262 0 37,022 0 5,336,166 -806 379 31,251 0 0 0 -246,496 0 36,531 0 5,126,201 0 0 0 0 --405,549 0 34,334 0 4,754,986 0 0 0 0 0 9 0 9 9 0 0 0 0 4,754,986 0 0 0 = 0 0 0 19 0 0 0 4,754,986 0 0 0 0 0 0 0 0 0 4,754,986 0 al 0 o 0 o 0 4,909 -913 620 35,867 0 0 0 0 0 5,443 -1,109 0 40,201 0 0 0 0 781 0 6,194 -2,002 0 45,174 0 5 0 - 0 P 0 880 6,975 -2,250 0 50,779 0 0 0 0 1,105 0 8,108 -2,627 0 57,365 ol 0 Retained Earnings 92,284 45,687 0 -12,188 -29,000 0 419 0 96,364 48,351 0 -12,803 -33,001 0 -581 0 98,330 278 59,531 0 -13,735 -73,056 0 -948 0 70,400 2,501 55,256 0 -14,129 0 -67,101 0 -1,029 0 45,898 -1.36 57,411 0 -14,087 0 -72,516 0 -1,604 0 14,966 0 94,680 0 -14,431 0 -85,502 0 -4,151 0 5,562 Accumulated Other Comprehensive Income/(Loss) -345 0 979 0 0 19 9 0 0 0 634 0 -784 0 0 0 0 0 -150 -278 0 -3,026 19 0 0 0 0 0 -3,454 89 0 2,781 0 0 9 0 9 0 0 0 0 0 -584 136 0 42 0 0 0 0 0 0 406 0 0 569 0 0 0 0 0 0 163 Total Shareholders' Equity 119,355 45,687 979 -12,188 -29,000 4,262 -1,225 379 128,249 18.351 -784 -12,803 -33,001 4,909 -1,494 670 134,047 0 59,531 -3,026 -13,735 -73,056 5,443 -2,057 0 107,147 2590 55,256 2,781 -14,129 781 -67,101 6,194 -3,031 0 90,488 57,411 42 -14,087 880 -72,516 6,975 -3,854 0 65,339 0 94,680 569 -14,431 1,105 85,502 8,108 -6,778 0 63,090 Reformulated Statement of Cash Flows (XX) (XX) XX Cash flow from operations Cash investment Free cash flow Equity financing flows: Dividends and share repurchases Share issues Debt financing flows: Net purchase of financial assets Interest on financial assets (after tax) Net issue of debt Interest on debt (after tax) Total financing flows slull P F d+F CONSOLIDATED BALANCE SHEETS {In millions, except number of shares which are reflected in thousands and par value) ASSETS: Current assets: Cash and cash equivalents Short-term marketable securities Accounts receivable, less allowances of $53 and $63, respectively Inventories Vendor non-trade receivables Other current assets Total current assets Non-current assets Long-term marketable securities Property, plant and equipment, net Other non-current assets Total non-current assets Total assets LIABILITIES AND SHAREHOLDER'S EQUITY: Current liabilities: Accounts payable Accrued Expenses Other current liabilities Deferred revenue Commercial paper Short term debt Total current liabilities Non-current liabilities: Deferred revenue, non-current Long term debt Other non-current liabilities Total non-current liabilities Total liabilities Commitments and contingencies Shareholders' equity: Common stock and additional paid-in capital, $0.00001 par value: Retained earnings Accumulated other comprehensive income/{loss) Total shareholders' equity Total liabilities and shareholders' equity Classification OA & FA FA OA OA FA FA FA OA FA FFFF99 OL OL FL FL FL IFL FL FL FL CSE September 15, 2021 34940 27699 26278 6580 25228 14111 134836 127877 39440 48849 216166 351002 54763 47493 7,612 6,000 9,613 125,481 109106 53325 162431 287912 57365 5562 163 63090 351002 September 26, 2020 38016 52927 16120 4061 21325 11264 143713 100887 36766 42522 180175 323888 42296 42684 6,643 4,996 8,773 105,392 98667 54490 153157 258549 50779 14966 -406 65339 323888 September 28, 2019 48844 51713 22926 4106 22878 12352 162819 105341 37378 32978 175697 338516 46236 37720 5,522 5,980 10,260 105,718 91807 50503 142310 248028 45174 45898 -584 90488 338516 September 29, 2018 25,913 40,388 23,186 3,956 25,809 12,087 131,339 170,799 41,304 22,283 234,386 $365,725 55,888 32,687 7,543 11,964 8,784 116,866 2,797 93,735 45,180 141,712 258,578 40,201 70,400 -3,454 107,147 $365,725 September 30, September 24, 2017 2016 20,289 20,484 53,892 46,671 17,874 15,754 4,855 2,132 17,799 13,545 13,936 8,283 128,645 106,869 194,714 170,430 33,783 27,010 18,177 17,377 246,674 214,817 375,319 $ 321,686 44,242 37,294 22,027 30,551 7,548 8,080 11,977 8,105 6,496 3,500 100,814 79,006 2,836 2,930 97,207 75,427 40,415 36,074 140,458 114,431 241,272 193,437 35,867 31,251 98,330 96,364 -1.50 134,047 634 128,249 $ 375,319 321,686 CONSOLIDATED STATEMENTS OF CASH FLOWS (In millions) Cash and cash equivalents, beginning of the year Operating activities: Net income Adjustments to reconcile net income to cash generated by operating activities: Depreciation and amortization Share-based compensation expense Deferred income tax expense/(benefit) Other Changes in operating assets and liabilities: Accounts receivable, net Inventories Vendor non-trade receivables Other current and non-current assets Accounts payable Deferred revenue Other current and non-current liabilities Cash generated by operating activities Investing activities: Purchases of marketable securities Proceeds from maturities of marketable securities Proceeds from sales of marketable securities Payment for acquisition of property, plant and equipment Payments made in connection with business acquisitions, net Purchases of non-marketable securities Proceeds from non-marketable securities Other Cash generated by investing activities Financing activities: Proceeds from issuance of common stock Payments for taxes related to net share settlement of equity awards Payments for dividends and dividend equivalents Repurchases of common stock Repayments of term debt Change in commercial paper, net Other Cash generated by financing activities Increase/{Decrease) in cash and cash equivalents Cash and cash equivalents, end of the year Supplemental cash flow disclosure: Cash paid for income taxes, net Cash paid for interest September 15, September 26, September 28, September 29, September 30, September 24, 2021 2020 2019 2018 2017 2016 39789 50224 25913 20,289 20,484 21,120 94680 57411 55256 59,531 48,351 45,687 11284 11056 12547 10,903 10,157 10,505 7906 6829 6068 5,340 4,840 4,210 -4774 -215 -340 -32,590 5,966 4,938 -147 -97 -652 -444 -166 486 -10125 6917 245 -5,322 -2,093 527 -2642 -127 -289 828 -2,723 217 -3903 1553 2931 -8,010 -4,254 -51 -8042 -9588 873 -423 -5,318 1,055 12326 -4062 -1923 9,175 8,966 2,117 1676 2081 -625 44 -626 -1,554 5799 8916 -4700 38,490 1,125 -1,906 104038 80674 69391 77,434 64,225 66,231 -109558 -114938 -39630 -71,356 -1.59,486 -142,428 59023 69918 40102 55,881 31,775 21,258 47460 50473 56988 47,838 94,564 90,536 -11085 -7309 -10495 -13,313 -12,451 -12,734 -33 -1524 -624 -721 -329 -297 -131 -210 -1001 -1,871 -521 -1,388 387 92 1634 353 126 -608 -791 -1078 -745 -124 -924 -14545 -4289 45896 16,066 -46,446 -45,977 1105 880 781 669 555 495 -6556 -3634 -2817 -2,527 -1,874 -1,570 -14467 -14081 -14119 -13,712 -12,769 -12,150 -85971 -72358 -66897 -72,738 -32,900 -29,722 20393 16091 6963 6,969 28,662 24,954 -8750 -12629 -8805 -6,500 -3,500 -2,500 1022 -963 -5977 -37 3,852 -397 -129 -126 -105 -93353 -86820 -90976 -87,876 -17,974 -20,890 -3860 -10435 24311 5,624 -195 --636 35929 39789 50224 25,913 20,289 20,484 25385 9501 15263 10,417 11,591 10,444 2687 3002 3423 3,022 2,092 1,316 APPLE INC. INCOME STATEMENTS (in millions) for the year ended October 30 2016-2021 Revenues Cost of sales Gross margin Operating expenses: Research and development Selling, general and administrative Total operating expenses Operating income Other income/expense, net Income before provision for income taxes Provision for income taxes Net income Earning per share: Basic Diluted Fiscal year Effective tax rate (from annual report) Shares used in computing eamings per share: Basic Diluted 2021 2020 2019 2018 2017 260,174 265,595 229,234 365,817 274,515 212,981 169,559 161,782 163,756 141,048 152,836 104,956 98,392 101,839 88,186 21,914 18,752 16,217 14,236 11,581 21,973 19,916 18,245 16,705 15,261 30,886 27,701 24,519 63,930 74,138 63,667 1,807 2,005 2,745 65,737 76,143 66,412 10,481 13,372 15,738 55,256 59,531 48,351 2.99 12.01 9.27 2.97 11.91 9.21 41,242 108,949 258 109,207 14,527 94,680 5.67 5.61 35,795 66,288 803 67,091 9,680 57,411 2021 3.31 3.28 2016 215,639 131,376 84,263 10,045 14,194 22,783 61,480 1,348 62,828 15,685 45,687 8.35 8.31 2020 2019 2018 2017 2016 13.30% 14.40% 15.90% 18.30% 24.60% 25.60% 16,701,272 17,352,119 18,471,336 4,955,377 5,217,242 5,470,820 16,864,919 17,528,214 18,595,651 5,000,109 5,251,692 5,500,281 APPLE INC.STATEMENT OF SHAREHOLDERS' EQUITY (in millions, except per share amount) Balance as of September 26, 2015 Net income Other comprehensive income/{loss) Dividends and dividend equivalents declared Repurchase of common stock Share-based compensation Common stock issued, net of shares witheld for employee taxes Tax benefit from equity awards, including transfer pricing adjustments Balance as of September 24, 2016 Net income Other comprehensive income/(loss) Dividends and dividend equivalents declared Repurchase of common stock Share-based compensation Common stock issued, net of shares witheld for employee taxes Tax benefit from equity awards, including transfer pricing adjustments Balance as of September 30, 2017 Cumulative effect of change in accounting principle Net income Other comprehensive income/{loss) Dividends and dividend equivalents declared Repurchase of common stock Share-based compensation Common stock issued, net of shares witheld for employee taxes Tax benefit from equity awards, including transfer pricing adjustments Balance as of September 29, 2018 Cumulative effect of change in accounting principle Net income Come Other comprehensive income/(loss) Dividends and dividend equivalents declared Common stock issued Repurchase of common stock Share-based compensation Common stock withheld related to net share settlement of equity awards Tax benefit from equity awards, including transfer pricing adjustments Balance as of September 28, 2019 Cumulative effect of change in accounting principle Mat Tam Net income Other comprehensive income/(loss) Dividends and dividend equivalents declared Common stock issued Repurchase of common stock Share-based compensation Common stock withheld related to net share settlement of equity awards Tax benefit from equity awards, including transfer pricing adjustments Balance as of September 26, 2020 Cumulative effect of change in accounting principle Net income Other comprehensive income/{loss) Dividends and dividend equivalents declared Common stock issued Repurchase of common stock Share-based compensation Common stock withheld related to net share settlement of equity awards Tax benefit from equity awards, including transfer pricing adjustments Balance of September 25, 2021 Common Stock and Additional Paid-In Capital Shares Amount 27,416 5,578,753 0 0 0 0 0 0 -279,609 0 4,262 0 37,022 0 5,336,166 -806 379 31,251 0 0 0 -246,496 0 36,531 0 5,126,201 0 0 0 0 --405,549 0 34,334 0 4,754,986 0 0 0 0 0 9 0 9 9 0 0 0 0 4,754,986 0 0 0 = 0 0 0 19 0 0 0 4,754,986 0 0 0 0 0 0 0 0 0 4,754,986 0 al 0 o 0 o 0 4,909 -913 620 35,867 0 0 0 0 0 5,443 -1,109 0 40,201 0 0 0 0 781 0 6,194 -2,002 0 45,174 0 5 0 - 0 P 0 880 6,975 -2,250 0 50,779 0 0 0 0 1,105 0 8,108 -2,627 0 57,365 ol 0 Retained Earnings 92,284 45,687 0 -12,188 -29,000 0 419 0 96,364 48,351 0 -12,803 -33,001 0 -581 0 98,330 278 59,531 0 -13,735 -73,056 0 -948 0 70,400 2,501 55,256 0 -14,129 0 -67,101 0 -1,029 0 45,898 -1.36 57,411 0 -14,087 0 -72,516 0 -1,604 0 14,966 0 94,680 0 -14,431 0 -85,502 0 -4,151 0 5,562 Accumulated Other Comprehensive Income/(Loss) -345 0 979 0 0 19 9 0 0 0 634 0 -784 0 0 0 0 0 -150 -278 0 -3,026 19 0 0 0 0 0 -3,454 89 0 2,781 0 0 9 0 9 0 0 0 0 0 -584 136 0 42 0 0 0 0 0 0 406 0 0 569 0 0 0 0 0 0 163 Total Shareholders' Equity 119,355 45,687 979 -12,188 -29,000 4,262 -1,225 379 128,249 18.351 -784 -12,803 -33,001 4,909 -1,494 670 134,047 0 59,531 -3,026 -13,735 -73,056 5,443 -2,057 0 107,147 2590 55,256 2,781 -14,129 781 -67,101 6,194 -3,031 0 90,488 57,411 42 -14,087 880 -72,516 6,975 -3,854 0 65,339 0 94,680 569 -14,431 1,105 85,502 8,108 -6,778 0 63,090 Reformulated Statement of Cash Flows (XX) (XX) XX Cash flow from operations Cash investment Free cash flow Equity financing flows: Dividends and share repurchases Share issues Debt financing flows: Net purchase of financial assets Interest on financial assets (after tax) Net issue of debt Interest on debt (after tax) Total financing flows slull P F d+F
Step by Step Solution
There are 3 Steps involved in it

Get step-by-step solutions from verified subject matter experts