

Question: Please help me solve a,b,c,d, and e Calculate the expected return of your portfolio. (Hint: The expected return of a portfolio equals the weighted average
- Calculate the expected return of your portfolio. (Hint: The expected return of a portfolio equals the weighted average of the individual stock's expected return, where the weights are the percentage invested in each stock.)
- Calculate the portfolio beta.
- Given the preceding information, plot the security market line on paper. Plot the stocks from your portfolio on your graph.
d. From your plot in part c, which stocks appear to be your winners and which ones appear to be losers? Why should you consider your conclusions in part d to be less than certain?
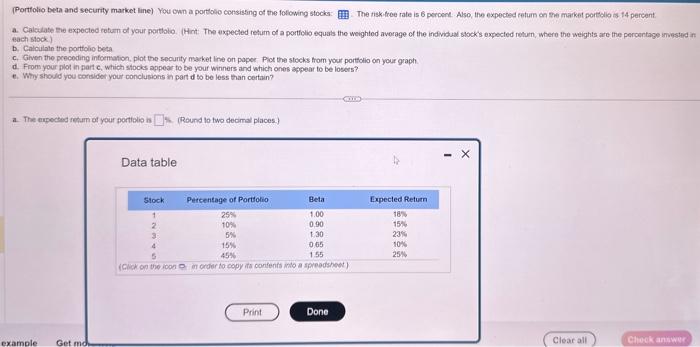
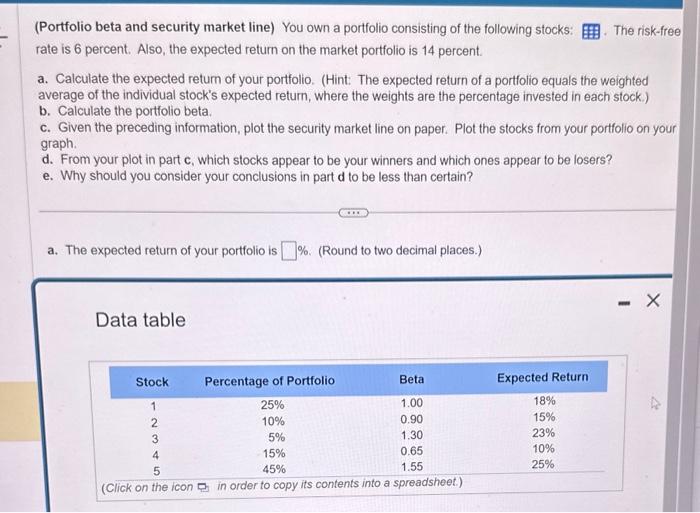
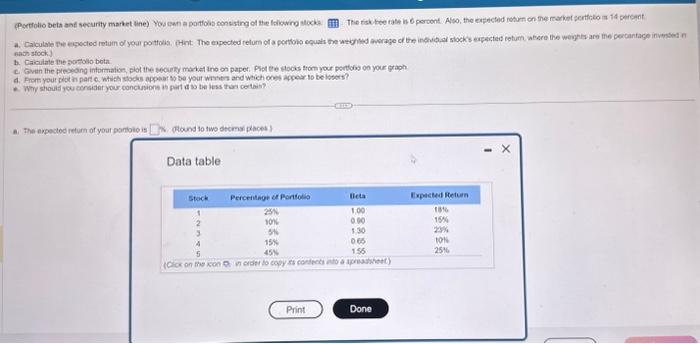
nath stock.) b. Caiculate the antobe beta A. The anpected retum of your partiolo is (ilound to two decma pacei } Data table (Porttolio beta and security market line) You own a portiolo consisting of the folowing stocks: The niskithee rate is 6 peroent. Also, the expected return on she market portolio is 14 percent. a. Calciate the expected rotarn of your portholo. (Hat: The axpected retum of a portfolo equals the weightod avorage of the indivdual slock's expected retun, where the weights are the percentage investid sach stock) b. Caloulate the partfolio beta c. Given the peecoding information, plot the seounity macket line on paper Plot the stocks hrom your porttolio on your graph. d. Frow your plot in part c, which stocks pppear to be your winners and which ones appear to be losers? e. Why should you corsider your conclusions in part d to be less than certain? a. The enipected retum of your portiolio in (i. (Round lo two decmal places) Data table (Portfolio beta and security market line) You own a portfolio consisting of the following stocks: . The risk-free rate is 6 percent. Also, the expected return on the market portfolio is 14 percent. a. Calculate the expected return of your portfolio. (Hint: The expected return of a portfolio equals the weighted average of the individual stock's expected return, where the weights are the percentage invested in each stock.) b. Calculate the portfolio beta. c. Given the preceding information, plot the security market line on paper. Plot the stocks from your portfolio on your graph. d. From your plot in part c, which stocks appear to be your winners and which ones appear to be losers? e. Why should you consider your conclusions in part d to be less than certain? a. The expected return of your portfolio is \%. (Round to two decimal places.) Data table nath stock.) b. Caiculate the antobe beta A. The anpected retum of your partiolo is (ilound to two decma pacei } Data table (Porttolio beta and security market line) You own a portiolo consisting of the folowing stocks: The niskithee rate is 6 peroent. Also, the expected return on she market portolio is 14 percent. a. Calciate the expected rotarn of your portholo. (Hat: The axpected retum of a portfolo equals the weightod avorage of the indivdual slock's expected retun, where the weights are the percentage investid sach stock) b. Caloulate the partfolio beta c. Given the peecoding information, plot the seounity macket line on paper Plot the stocks hrom your porttolio on your graph. d. Frow your plot in part c, which stocks pppear to be your winners and which ones appear to be losers? e. Why should you corsider your conclusions in part d to be less than certain? a. The enipected retum of your portiolio in (i. (Round lo two decmal places) Data table (Portfolio beta and security market line) You own a portfolio consisting of the following stocks: . The risk-free rate is 6 percent. Also, the expected return on the market portfolio is 14 percent. a. Calculate the expected return of your portfolio. (Hint: The expected return of a portfolio equals the weighted average of the individual stock's expected return, where the weights are the percentage invested in each stock.) b. Calculate the portfolio beta. c. Given the preceding information, plot the security market line on paper. Plot the stocks from your portfolio on your graph. d. From your plot in part c, which stocks appear to be your winners and which ones appear to be losers? e. Why should you consider your conclusions in part d to be less than certain? a. The expected return of your portfolio is \%. (Round to two decimal places.) Data table
Step by Step Solution
There are 3 Steps involved in it

Get step-by-step solutions from verified subject matter experts