Question: Please help me solve for NPV, PI, IRR, and PP base year sEssmmnnnsrnTOTACaSt VOArS s ($000s) 2010 2011 2012 2013 2014 2015 Investment in equipment
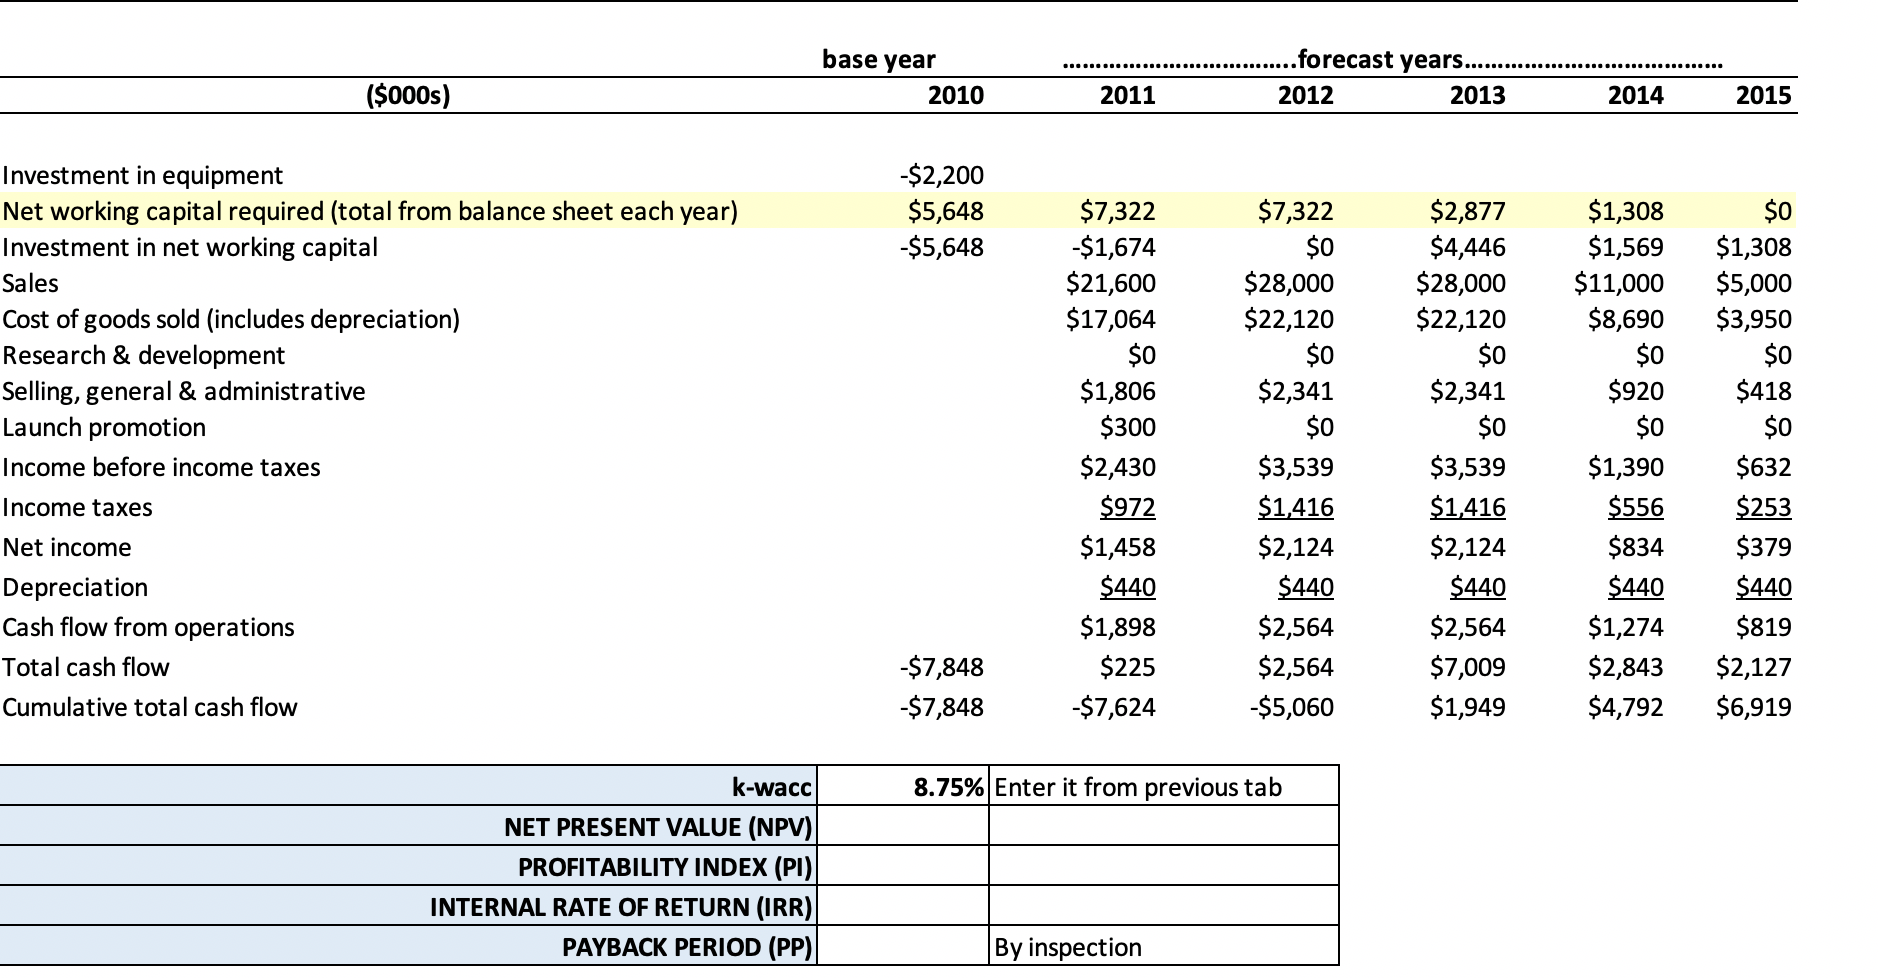
Please help me solve for NPV, PI, IRR, and PP
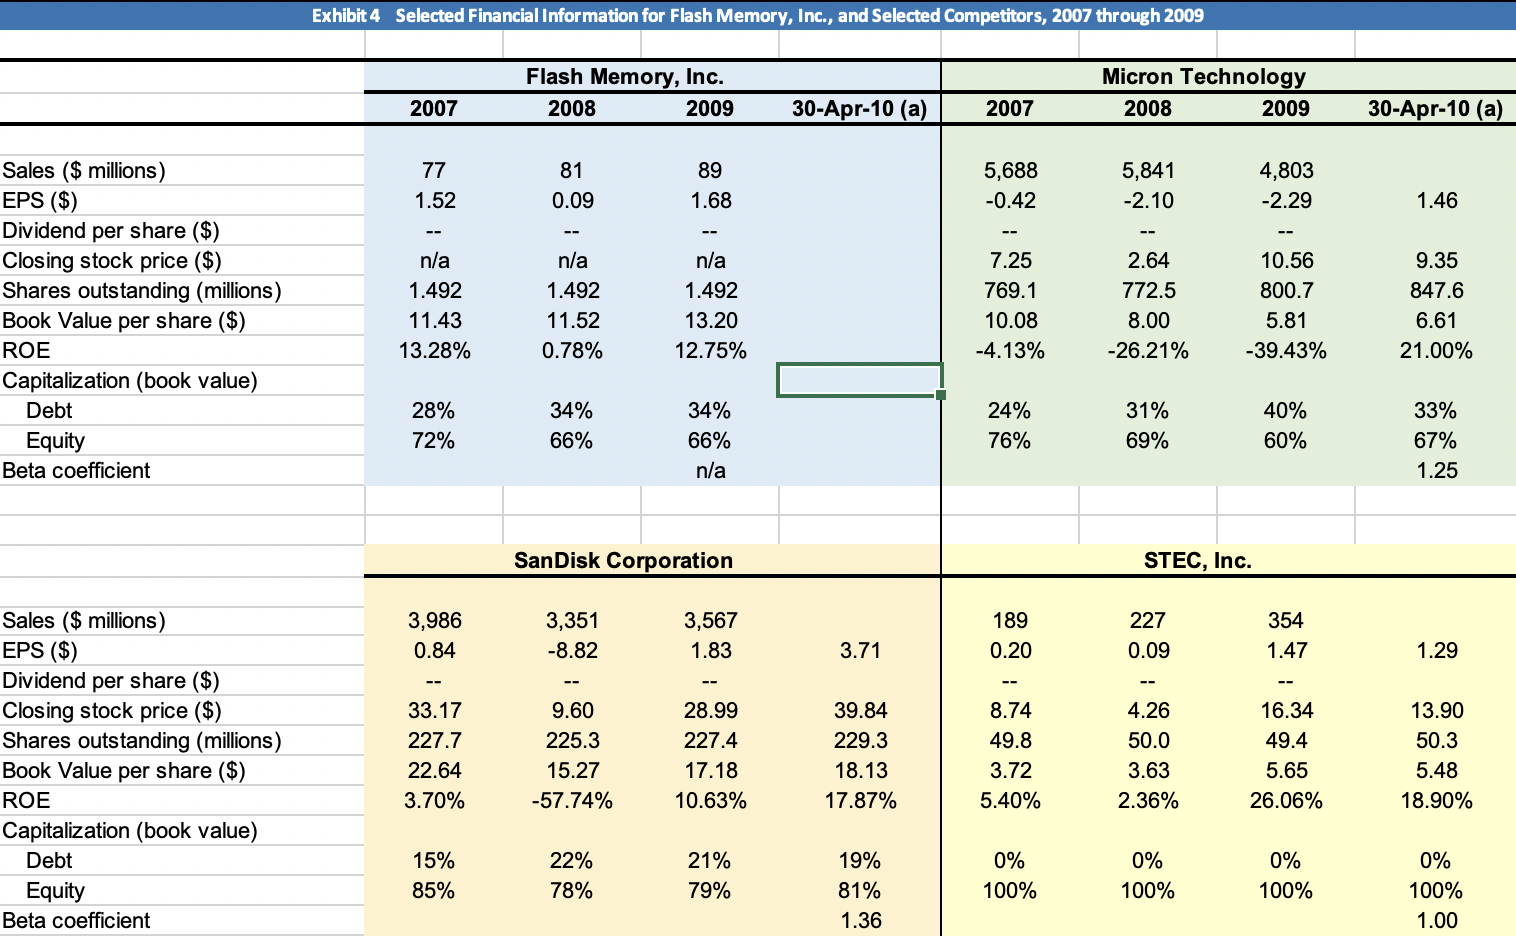
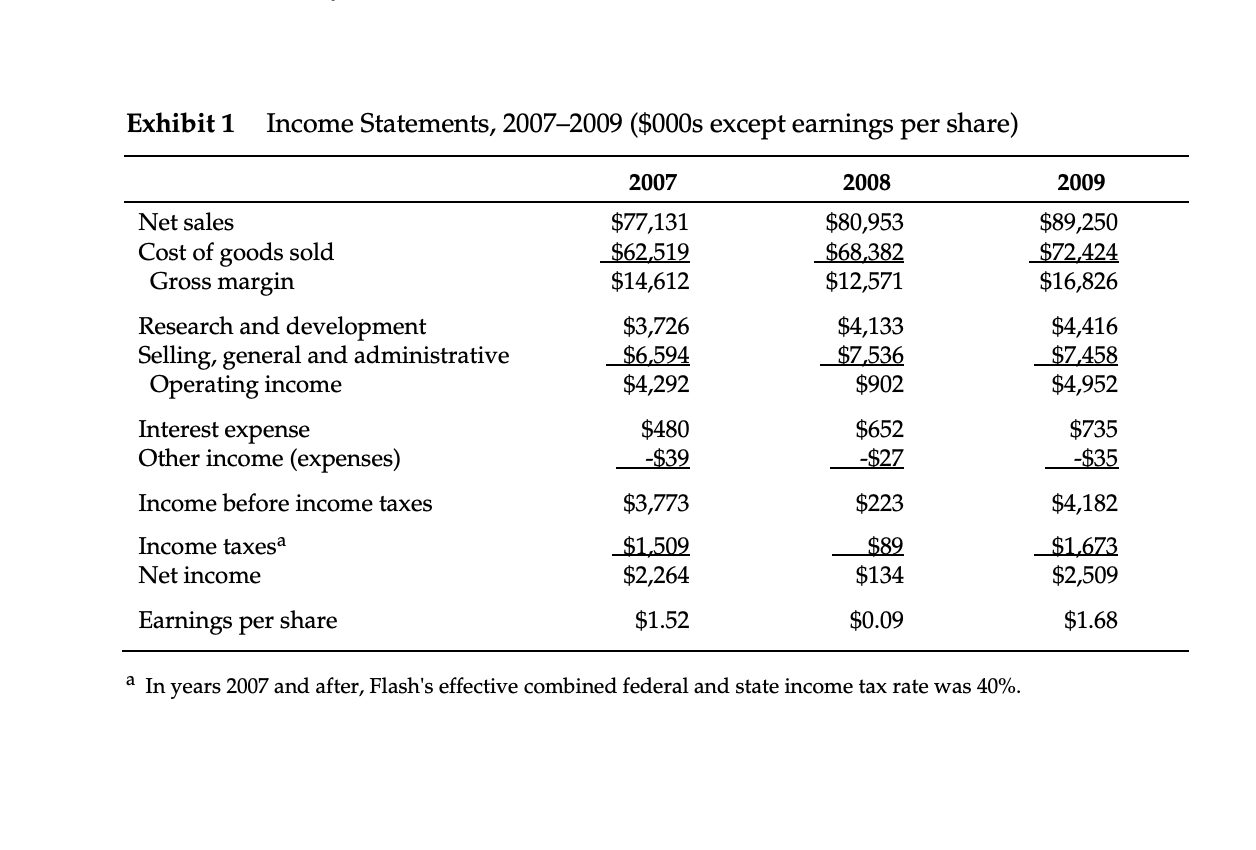
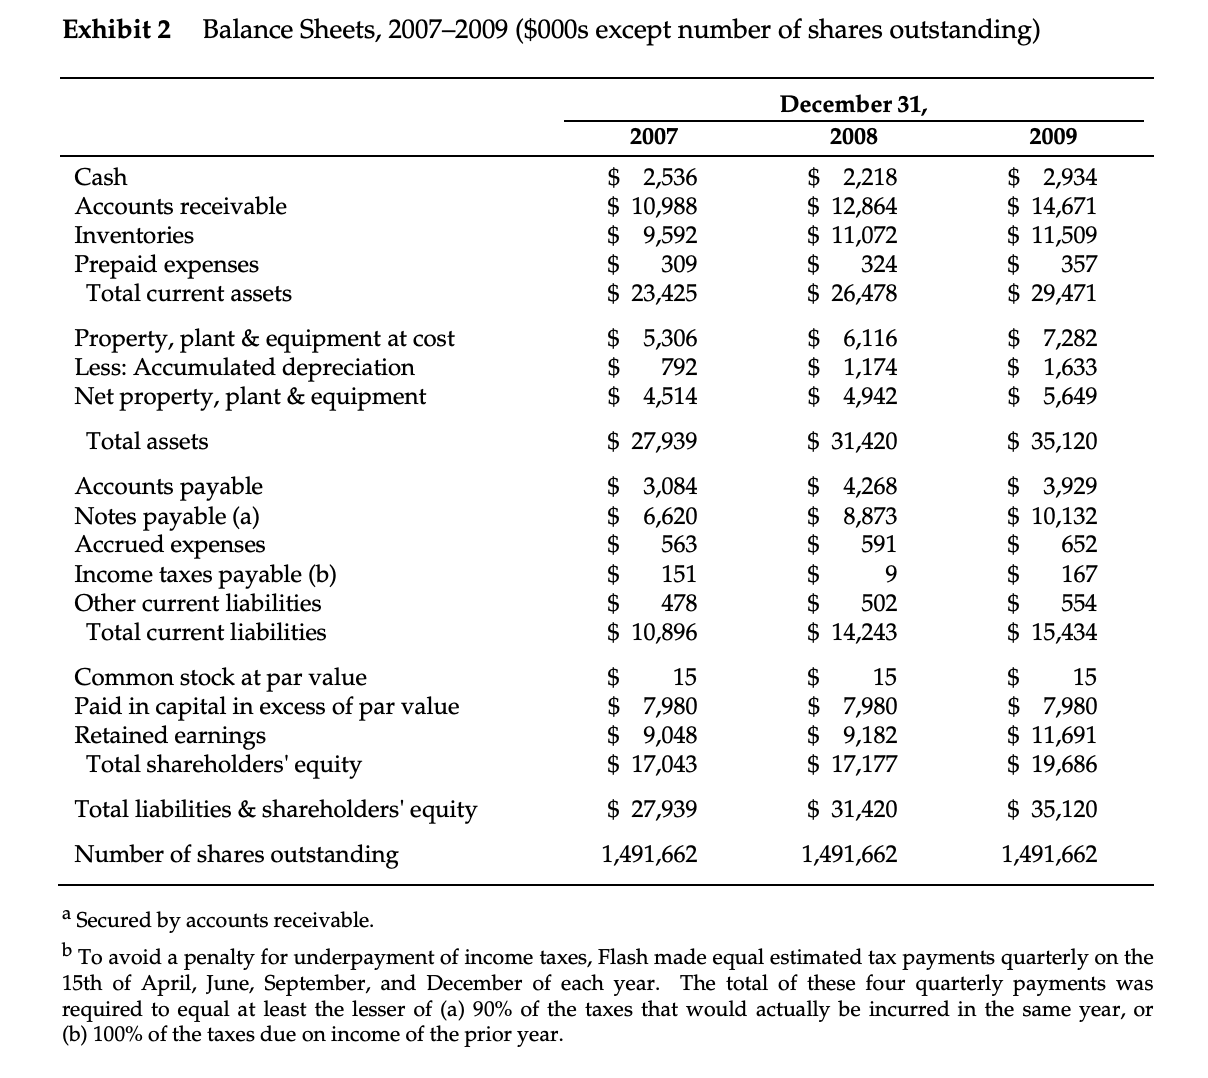
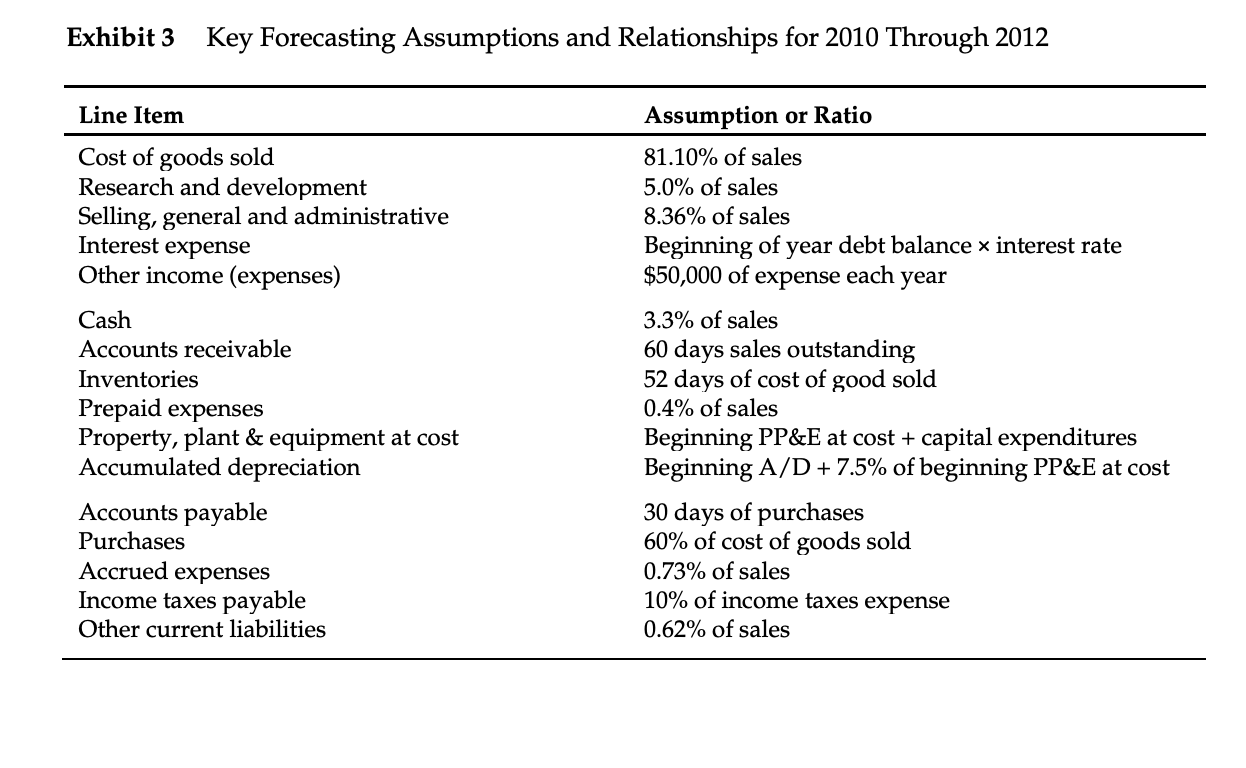
base year sEssmmnnnsrnTOTACaSt VOArS s ($000s) 2010 2011 2012 2013 2014 2015 Investment in equipment -$2,200 Net working capital required (total from balance sheet each year) $5,648 $7,322 $7,322 $2,877 $1,308 SO Investment in net working capital -$5,648 -$1,674 S0 $4,446 $1,569 $1,308 Sales $21,600 $28,000 $28,000 $11,000 $5,000 Cost of goods sold (includes depreciation) $17,064 $22,120 $22,120 $8,690 $3,950 Research & development S0 S0 S0 $S0 S0 Selling, general & administrative $1,806 $2,341 $2,341 $920 $418 Launch promotion $300 S0 S0 S0 SO Income before income taxes $2,430 $3,539 $3,539 $1,390 $632 Income taxes $972 $1,416 $1.416 $556 $253 Net income $1,458 $2,124 $2,124 5834 $379 Depreciation $440 $440 $440 $440 $440 Cash flow from operations $1,898 $2,564 $2,564 $1,274 $819 Total cash flow -$7,848 $225 $2,564 $7,009 $2,843 $2,127 Cumulative total cash flow -$7,848 $7,624 -$5,060 $1,949 $4,792 $6,919 k-wacc 8.75%|Enter it from previous tab NET PRESENT VALUE (NPV) PROFITABILITY INDEX (PI) INTERNAL RATE OF RETURN (IRR) PAYBACK PERIOD (PP) By inspection Exhibit 4 Selected Financial Information for Flash Memory, Inc., and Selected Competitors, 2007 through 2009 Flash Memory, Inc. Micron Technology 2007 2008 2009 30-Apr-10 (a) 2007 2008 2009 30-Apr-10 (a) Sales ($ millions) 77 81 89 5,688 5,841 4,803 EPS ($) 1.52 0.09 1.68 -0.42 -2.10 -2.29 1.46 Dividend per share ($) Closing stock price ($) n/a n/a n/a 7.25 2.64 10.56 9.35 Shares outstanding (millions) 1.492 1.492 1.492 769.1 772.5 800.7 847.6 Book Value per share ($) 11.43 11.52 13.20 10.08 8.00 5.81 6.61 ROE 13.28% 0.78% 12.75% -4.13% -26.21% -39.43% 21.00% Capitalization (book value) Debt 28% 34% 34% 24% 31% 40% 33% Equity 72% 66% 66% 76% 69% 60% 67% Beta coefficient n/a 1.25 SanDisk Corporation STEC, Inc. Sales ($ millions) 3,986 3,351 3,567 189 227 354 EPS ($) 0.84 -8.82 1.83 3.71 0.20 0.09 1.47 1.29 Dividend per share ($) Closing stock price ($) 33.17 9.60 28.99 39.84 8.74 4.26 16.34 13.90 Shares outstanding (millions) 227.7 225.3 227.4 229.3 49.8 50.0 49.4 50.3 Book Value per share ($) 22.64 15.27 17.18 18.13 3.72 3.63 5.65 5.48 ROE 3.70% -57.74% 10.63% 17.87% 5.40% 2.36% 26.06% 18.90% Capitalization (book value) Debt 15% 22% 21% 19% 0% 0% 0% 0% Equity 85% 78% 79% 81% 100% 100% 100% 100% Beta coefficient 1.36 1.00Exhibit1 Income Statements, 2007-2009 ($000s except earnings per share) 2007 2008 2009 Net sales $77,131 $80,953 $89,250 Cost of goods sold $62,519 $68,382 $72,424 Gross margin $14,612 $12,571 $16,826 Research and development $3,726 $4,133 $4,416 Selling, general and administrative $6.594 $7.536 $7.458 Operating income $4,292 $902 $4,952 Interest expense $480 $652 $735 Other income (expenses) -$39 -$27 -$35 Income before income taxes $3,773 $223 $4,182 Income taxes? _$1.509 _$89 _$1.673 Net income $2,264 $134 $2,509 Earnings per share $1.52 $0.09 $1.68 2 Tn years 2007 and after, Flash's effective combined federal and state income tax rate was 40%. Exhibit 2 Balance Sheets, 2007-2009 ($000s except number of shares outstanding) December 31, 2007 2008 2009 Cash $ 2,536 $ 2,218 $ 2,934 Accounts receivable $ 10,988 $ 12,864 $ 14,671 Inventories $ 9,592 $ 11,072 $ 11,509 Prepaid expenses $ 309 $ 324 $ 357 Total current assets $ 23,425 $ 26,478 $ 29471 Property, plant & equipment at cost $ 5306 $ 6,116 $ 7,282 Less: Accumulated depreciation $ 792 $ 1,174 $ 1,633 Net property, plant & equipment $ 4514 $ 4,942 $ 5649 Total assets $ 27,939 $ 31,420 $ 35,120 Accounts payable $ 3,084 $ 4,268 $ 3,929 Notes payable (a) $ 6,620 $ 8,873 $ 10,132 Accrued expenses $ 563 $ 591 $ 652 Income taxes payable (b) $ 151 $ 9 $ 167 Other current liabilities $ 478 $ 502 $ 554 Total current liabilities $ 10,896 $ 14,243 $ 15,434 Common stock at par value $ 15 $ 15 $ 15 Paid in capital in excess of par value $ 7,980 $ 7,980 $ 7,980 Retained earnings $ 9,048 $ 9,182 $ 11,691 Total shareholders' equity $ 17,043 $ 17,177 $ 19,686 Total liabilities & shareholders' equity $ 27,939 $ 31,420 $ 35,120 Number of shares outstanding 1,491,662 1,491,662 1,491,662 4 Secured by accounts receivable. b To avoid a penalty for underpayment of income taxes, Flash made equal estimated tax payments quarterly on the 15th of April, June, September, and December of each year. The total of these four quarterly payments was required to equal at least the lesser of (a) 90% of the taxes that would actually be incurred in the same year, or (b) 100% of the taxes due on income of the prior year. Exhibit 3 Key Forecasting Assumptions and Relationships for 2010 Through 2012 Line Item Cost of goods sold Research and development Selling, general and administrative Interest expense Other income (expenses) Cash Accounts receivable Inventories Prepaid expenses Property, plant & equipment at cost Accumulated depreciation Accounts payable Purchases Accrued expenses Income taxes payable Other current liabilities Assumption or Ratio 81.10% of sales 5.0% of sales 8.36% of sales Beginning of year debt balance x interest rate $50,000 of expense each year 3.3% of sales 60 days sales outstanding 52 days of cost of good sold 0.4% of sales Beginning PP&E at cost + capital expenditures Beginning A /D + 7.5% of beginning PP&E at cost 30 days of purchases 60% of cost of goods sold 0.73% of sales 10% of income taxes expense 0.62% of sales
Step by Step Solution
There are 3 Steps involved in it
1 Expert Approved Answer
Step: 1 Unlock
Question Has Been Solved by an Expert!
Get step-by-step solutions from verified subject matter experts
Step: 2 Unlock
Step: 3 Unlock
Students Have Also Explored These Related Finance Questions!