

Question: Please help me solve for the test statistic, thank you! x 10.2.23-T The blood pressure measurements of a single patient were taken by twelve different
Please help me solve for the test statistic, thank you!
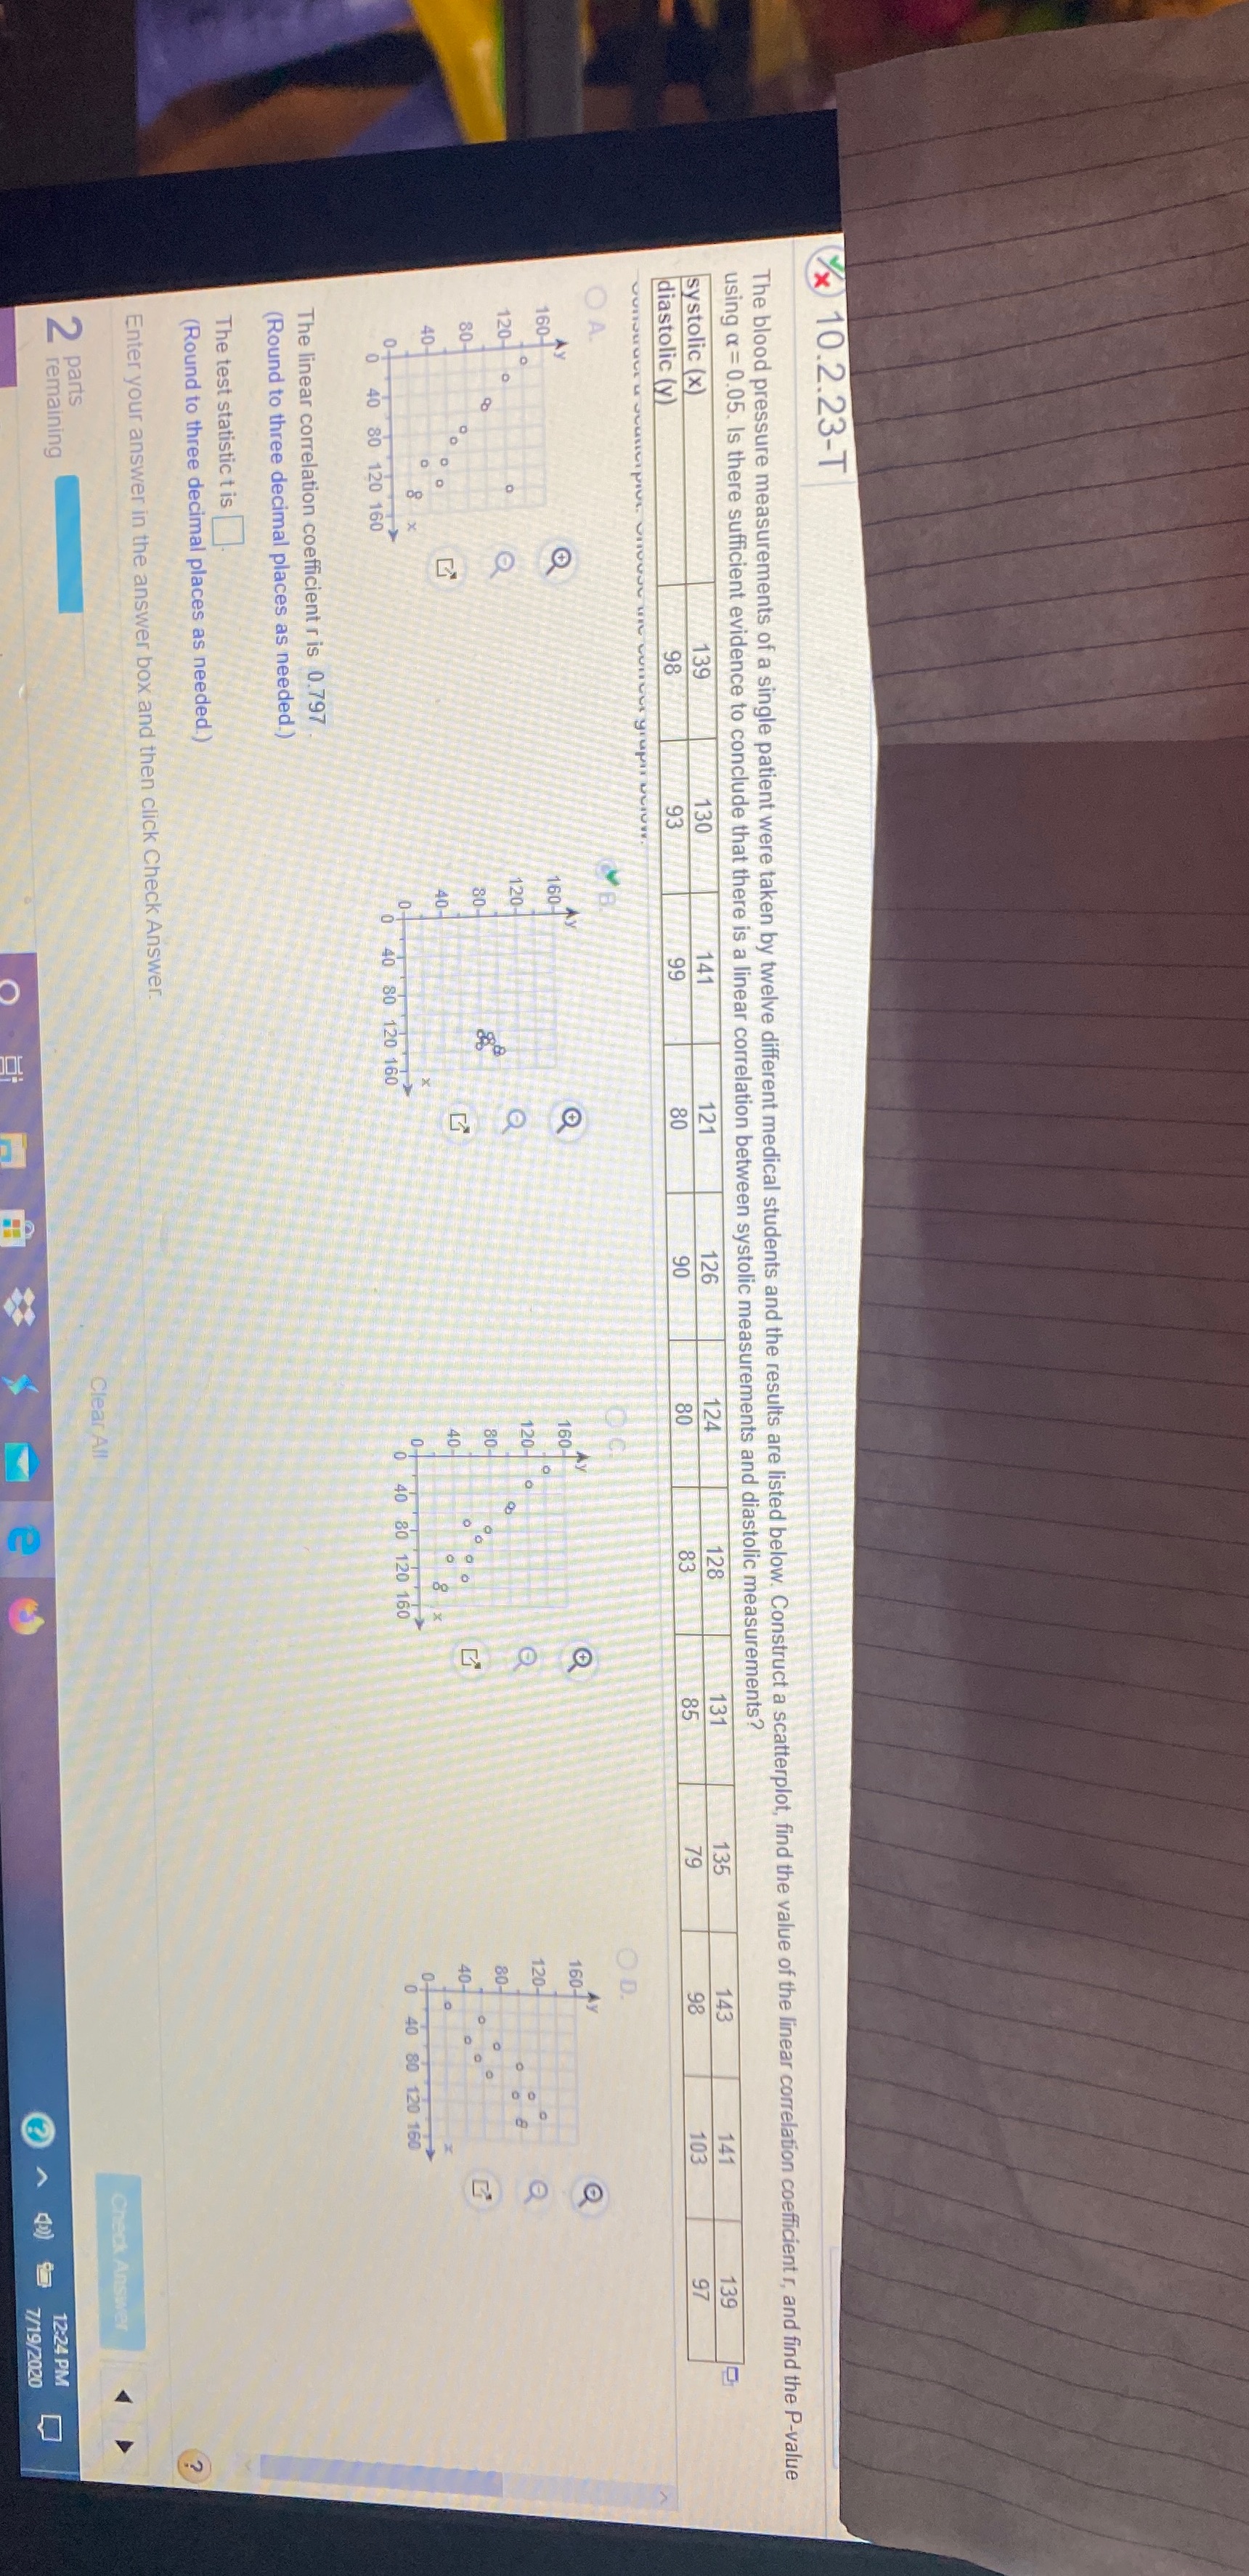
x 10.2.23-T The blood pressure measurements of a single patient were taken by twelve different medical students and the results are listed below. Construct a scatterplot, find the value of the linear correlation coefficient r, and find the P-value using a =0.05. Is there sufficient evidence to conclude that there is a linear correlation between systolic measurements and diastolic measurements? systolic (x) diastolic (y) 139 121 126 24 90 98 O A. O D. 160- 160 160- 160- 120-o 20- 120- 120- 80- 80- 60- 40- 40- o o 8 40- 40 80 120 160 40 80 120 160 40 80 120 160 40 80 120 160 The linear correlation coefficient r is 0.797 (Round to three decimal places as needed.) The test statistic tis ]. (Round to three decimal places as needed.) Enter your answer in the answer box and then click Check Answer. parts remaining Clear All Check Answe 12:24 PM 7/19/2020
Step by Step Solution
There are 3 Steps involved in it

Get step-by-step solutions from verified subject matter experts