

Question: Please help me solve mework. Chapter 6 Practice Save Score: 0 of 1 pt 37 of 58 (35 complete) HW Score: 57.33%, 33.25 of 58
Please help me solve
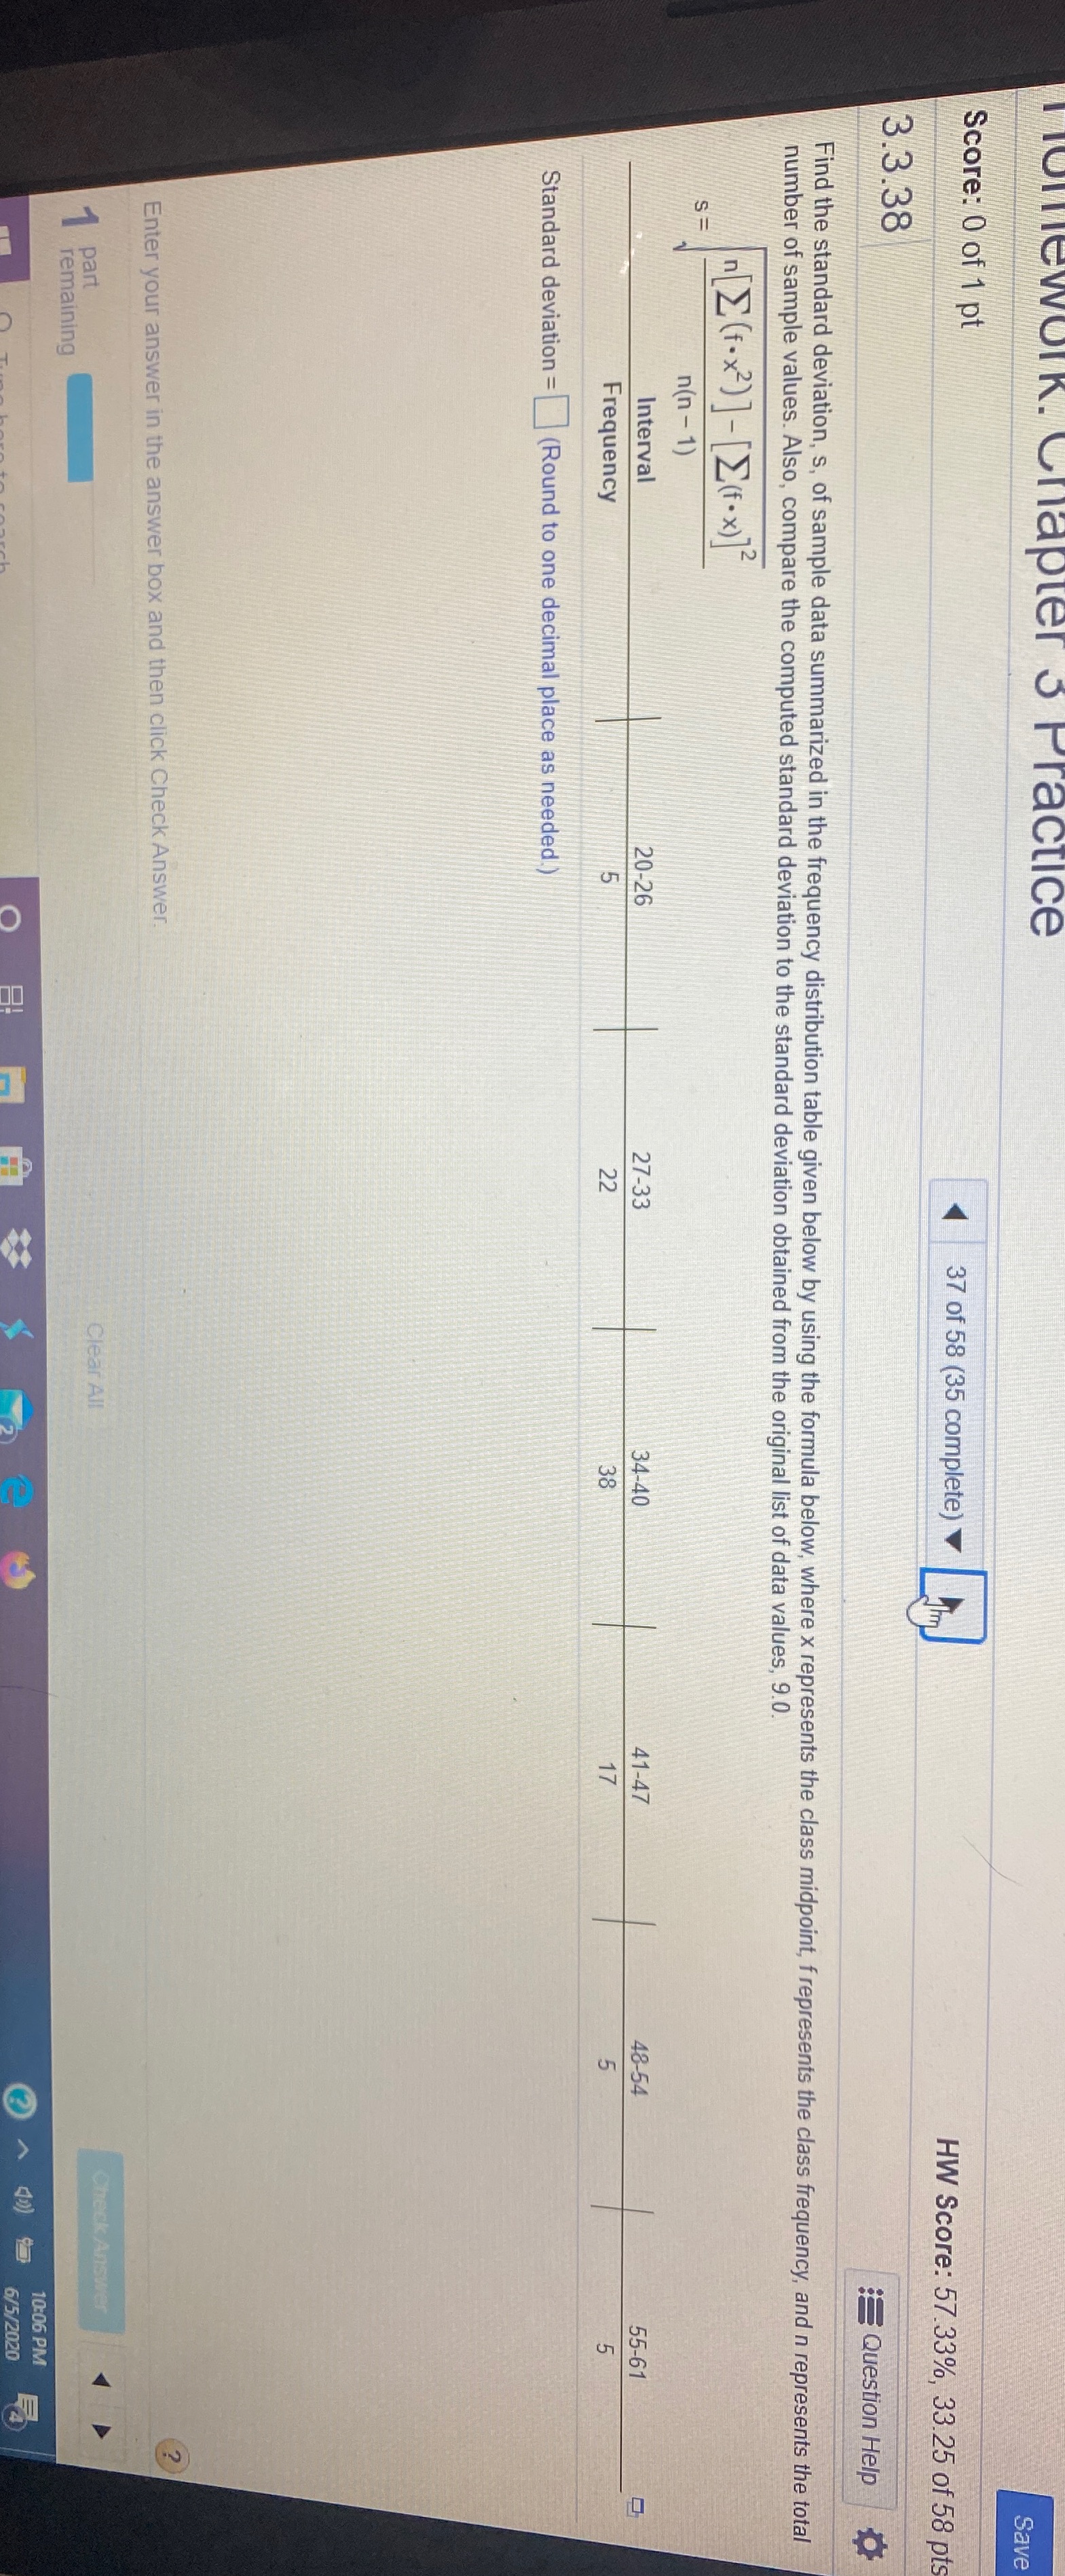
mework. Chapter 6 Practice Save Score: 0 of 1 pt 37 of 58 (35 complete) HW Score: 57.33%, 33.25 of 58 pt 3.3.38 Question Help Find the standard deviation, s, of sample data summarized in the frequency distribution table given below by using the formula below, where x represents the class midpoint, f represents the class frequency, and n represents the total number of sample values. Also, compare the computed standard deviation to the standard deviation obtained from the original list of data values, 9.0. S = " [ E (F. x 7 ) ] - [[ (F. x ) 12 n(n - 1) Interval 20-26 27-33 34-40 41-47 48-54 55-61 Frequency LO Standard deviation = (Round to one decimal place as needed.) Enter your answer in the answer box and then click Check Answer. part Clear All Check Answer remaining 10:06 PM 6/5/2020
Step by Step Solution
There are 3 Steps involved in it

Get step-by-step solutions from verified subject matter experts