

Question: Please help me solve part e where the shared value if all three were different on the last page. If there are any calculations for
Please help me solve part e where the shared value if all three were different on the last page. If there are any calculations for the financial calculator, please elaborate on how to solve it. Thank you!
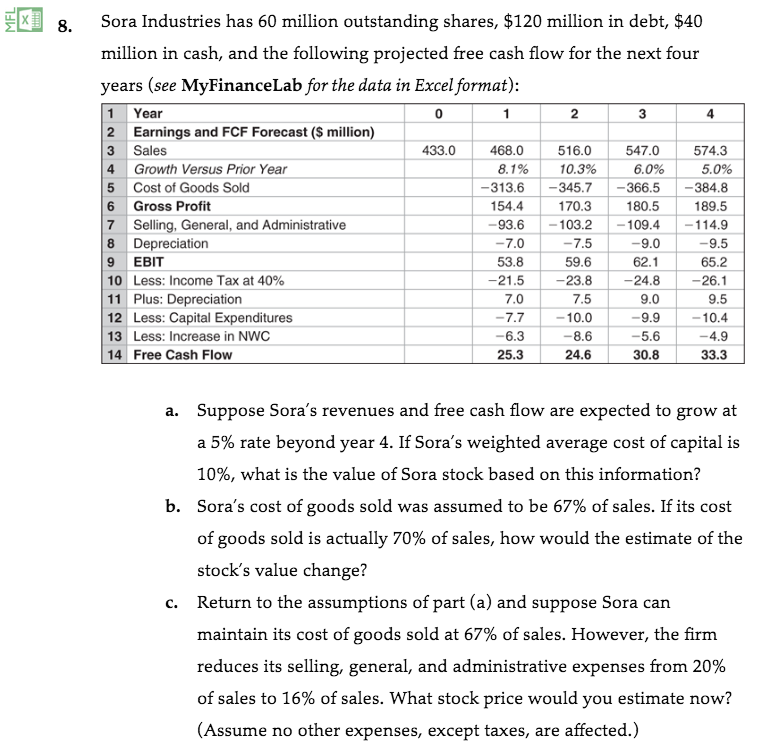
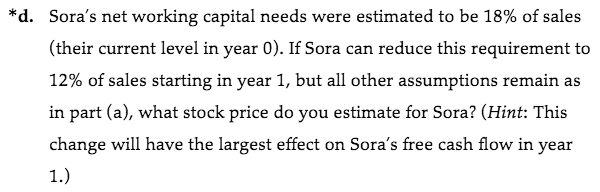
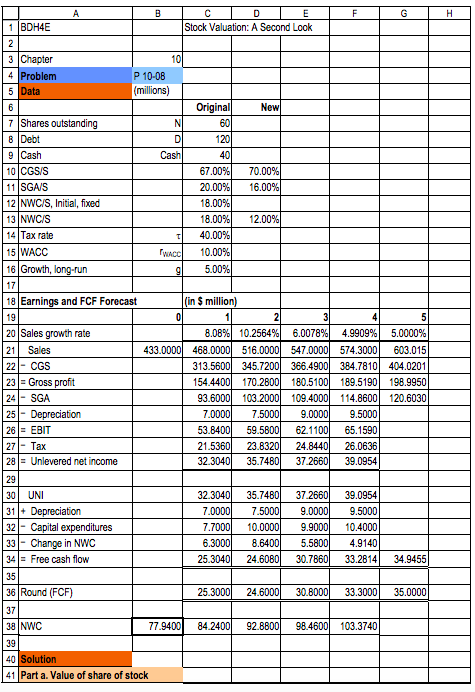
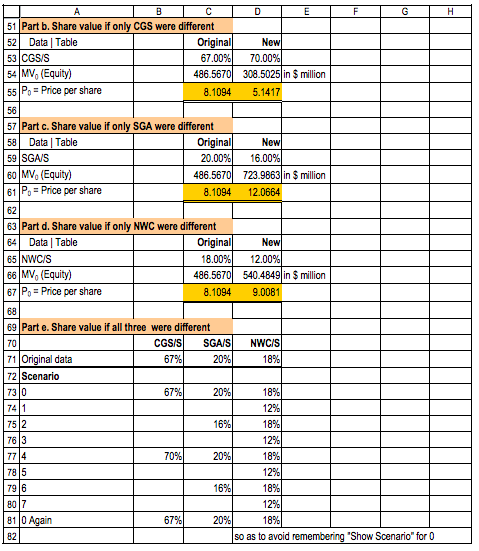
X8. Sora Industries has 60 million outstanding shares, $120 million in debt, $40 million in cash, and the following projected free cash flow for the next four years (see MyFinanceLab for the data in Excel format) 1 Year 2 Earnings and FCF Forecast (S million) 3 Sales 4 Growth Versus Prior Year 5 Cost of Goods Sold 6 Gross Profit 7 Selling, General, and Administrative 8 Depreciation 9 EBIT 10 Less: Income Tax at 40% 11 Plus: Depreciation 12 Less: Capital Expenditures 13 Les: Increase in NWC 14 Free Cash Flow 2 3 4 433.0468.0 8.1% 516.0 10.3% 547.0 574.3 6.0% 5.0% -313.6-345.7 366.5 384.8 189.5 -103.2 |-109.4 |-114.9 9.5 65.2 26.1 9.5 9.9-10.4 -4.9 33.3 154.4 170.3 180.5 53.8 -21.5 7.0 9.0 62.1 -24.8 9.0 59.6 23.8 7.5 7.7-10.0 8.6 24.6 -6.3 25.3 5.6 30.8 Suppose Sora's revenues and free cash flow are expected to grow at a 5% rate beyond year 4. If Sora's weighted average cost of capital is 10%, what is the value of Sora stock based on this information? Sora's cost of goods sold was assumed to be 67% of sales. If its cost of goods sold is actually 70% of sales, how would the estimate of the stock's value change? Return to the assumptions of part (a) and suppose Sora can maintain its cost of goods sold at 67% of sales. However, the firm reduces its selling, general, and administrative expenses from 20% of sales to 16% of sales. What stock price would you estimate now? (Assume no other expenses, except taxes, are affected.) a. b. c. *d. Sora's net working capital needs were estimated to be 18% of sales (their current level in year 0). If Sora can reduce this requirement to 12% of sales starting in year 1, but all other assumptions remain as in part (a), what stock price do you estimate for Sora? (Hint: This change will have the largest effect on Sora's free cash flow in year 1BDH4E Stock Valuation: A Second Lock Chapter 4 Problem P 10-08 millions) Original 7 Shares outstanding 8 Debt Cash 0 CGSS 11 ISGA/S 12 NWCIS, Initial, fixed 13 NWCIS 14 Tax rate 15 WAC 16 Growth, long-run 67.00%) 20.00%) 18.00% 18.00%) 40.00% 10.00% 5.00% 70.00% 16.00% 12.00% 18 Earnings and FCF Forecast 19 20 Sales growth rate 21 Sales 22-CGS 23 Gross 24 SGA in S milli 8.08%) 10.2564%) 516 345. 6.0078%) 4.9909% 5.0000% 574.3000 603.015 384.7810 404.0201 189.5 1 901 114.8600120.6030 433 547 366.4 180.51 109 154.4400170.2 198.9950 103 5Depeciation 261= EBIT 27Ta 28EUnlevered net income 9.5000 65.1590 53.840 62.11 23.83 32.304035.74 4.8440 26.0636 39.0954 30 UNI 35.7 39.0954 9.5000 0.4000 4.9140 33.281434.9455 2-Capital expenditures in NWC 8.64 34E Free cash flow 30.7 3 Round (FCF) 37 38 NWC 24 33.300035.0000 77.9400 84 103.3740 41 Part a. Value of share of stock 30.7 44 Total free cash flow 45 PV (FCF 46PVo (FCF) Enterprise value 47 732.1908 20.337223.1300500.0962 566.5670 49 P.-Price per share 8.1094C48/C7 51 Part b. Share value if only CGS were different 52Data | Table 53 CGSS 54MV (Equity) 55 P,-Price per share 56 57 Part c. Share value if only SGA were different 58Data | Table 59 SGA/S 60 MV (Equity) 61 P Price per share 62 63 Part d. Share value if only NWC were different 64 Data | Table 65 NWCIS 6MV, (Equity) 67 Po Price per share 60 69 Part e. Share value if all three were different 70 1inal data inal 67.00%) 486.5670 70.00% 308.5025 in $ million .1094 5.1417 inal 20.00%) 16.00% 486.5670 723.9863 in $ million 8.1094 12.0664 Original 18.00%) 12.0 486.5670 540.4849 in $ million 8.1094 9.0081 CGSIS 67% SGAS 20% NWC/S 18% 2Scenario 18% 12% 18% 12% 18% 12% 18% 12% 18% 67% 20% 16% 77 4 70% 20% 16% 67% 20% so as to avcid Show Scenario" for 0 X8. Sora Industries has 60 million outstanding shares, $120 million in debt, $40 million in cash, and the following projected free cash flow for the next four years (see MyFinanceLab for the data in Excel format) 1 Year 2 Earnings and FCF Forecast (S million) 3 Sales 4 Growth Versus Prior Year 5 Cost of Goods Sold 6 Gross Profit 7 Selling, General, and Administrative 8 Depreciation 9 EBIT 10 Less: Income Tax at 40% 11 Plus: Depreciation 12 Less: Capital Expenditures 13 Les: Increase in NWC 14 Free Cash Flow 2 3 4 433.0468.0 8.1% 516.0 10.3% 547.0 574.3 6.0% 5.0% -313.6-345.7 366.5 384.8 189.5 -103.2 |-109.4 |-114.9 9.5 65.2 26.1 9.5 9.9-10.4 -4.9 33.3 154.4 170.3 180.5 53.8 -21.5 7.0 9.0 62.1 -24.8 9.0 59.6 23.8 7.5 7.7-10.0 8.6 24.6 -6.3 25.3 5.6 30.8 Suppose Sora's revenues and free cash flow are expected to grow at a 5% rate beyond year 4. If Sora's weighted average cost of capital is 10%, what is the value of Sora stock based on this information? Sora's cost of goods sold was assumed to be 67% of sales. If its cost of goods sold is actually 70% of sales, how would the estimate of the stock's value change? Return to the assumptions of part (a) and suppose Sora can maintain its cost of goods sold at 67% of sales. However, the firm reduces its selling, general, and administrative expenses from 20% of sales to 16% of sales. What stock price would you estimate now? (Assume no other expenses, except taxes, are affected.) a. b. c. *d. Sora's net working capital needs were estimated to be 18% of sales (their current level in year 0). If Sora can reduce this requirement to 12% of sales starting in year 1, but all other assumptions remain as in part (a), what stock price do you estimate for Sora? (Hint: This change will have the largest effect on Sora's free cash flow in year 1BDH4E Stock Valuation: A Second Lock Chapter 4 Problem P 10-08 millions) Original 7 Shares outstanding 8 Debt Cash 0 CGSS 11 ISGA/S 12 NWCIS, Initial, fixed 13 NWCIS 14 Tax rate 15 WAC 16 Growth, long-run 67.00%) 20.00%) 18.00% 18.00%) 40.00% 10.00% 5.00% 70.00% 16.00% 12.00% 18 Earnings and FCF Forecast 19 20 Sales growth rate 21 Sales 22-CGS 23 Gross 24 SGA in S milli 8.08%) 10.2564%) 516 345. 6.0078%) 4.9909% 5.0000% 574.3000 603.015 384.7810 404.0201 189.5 1 901 114.8600120.6030 433 547 366.4 180.51 109 154.4400170.2 198.9950 103 5Depeciation 261= EBIT 27Ta 28EUnlevered net income 9.5000 65.1590 53.840 62.11 23.83 32.304035.74 4.8440 26.0636 39.0954 30 UNI 35.7 39.0954 9.5000 0.4000 4.9140 33.281434.9455 2-Capital expenditures in NWC 8.64 34E Free cash flow 30.7 3 Round (FCF) 37 38 NWC 24 33.300035.0000 77.9400 84 103.3740 41 Part a. Value of share of stock 30.7 44 Total free cash flow 45 PV (FCF 46PVo (FCF) Enterprise value 47 732.1908 20.337223.1300500.0962 566.5670 49 P.-Price per share 8.1094C48/C7 51 Part b. Share value if only CGS were different 52Data | Table 53 CGSS 54MV (Equity) 55 P,-Price per share 56 57 Part c. Share value if only SGA were different 58Data | Table 59 SGA/S 60 MV (Equity) 61 P Price per share 62 63 Part d. Share value if only NWC were different 64 Data | Table 65 NWCIS 6MV, (Equity) 67 Po Price per share 60 69 Part e. Share value if all three were different 70 1inal data inal 67.00%) 486.5670 70.00% 308.5025 in $ million .1094 5.1417 inal 20.00%) 16.00% 486.5670 723.9863 in $ million 8.1094 12.0664 Original 18.00%) 12.0 486.5670 540.4849 in $ million 8.1094 9.0081 CGSIS 67% SGAS 20% NWC/S 18% 2Scenario 18% 12% 18% 12% 18% 12% 18% 12% 18% 67% 20% 16% 77 4 70% 20% 16% 67% 20% so as to avcid Show Scenario" for 0
Step by Step Solution
There are 3 Steps involved in it

Get step-by-step solutions from verified subject matter experts