

Question: Please help me solve question e, thank you Security A is currently priced at $75 per share and security B is currently priced at $30
Please help me solve question e, thank you
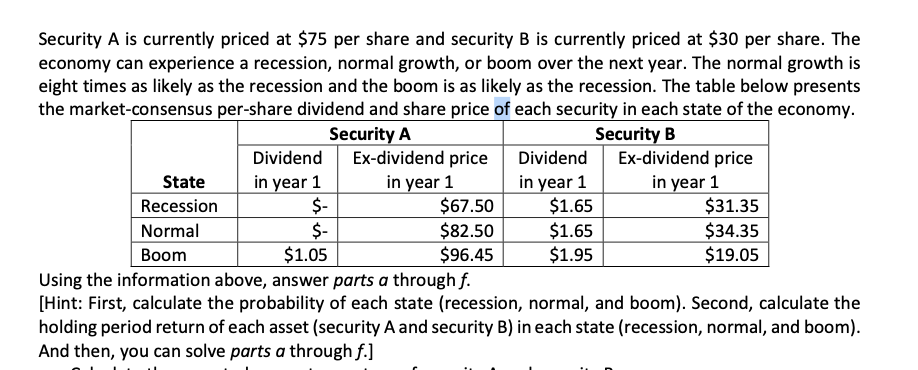
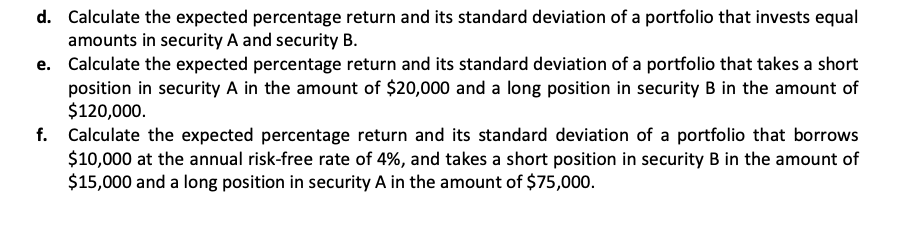
Security A is currently priced at $75 per share and security B is currently priced at $30 per share. The economy can experience a recession, normal growth, or boom over the next year. The normal growth is eight times as likely as the recession and the boom is as likely as the recession. The table below presents the market-consensus per-share dividend and share price of each security in each state of the economy. Security A Security B Dividend Ex-dividend price Dividend Ex-dividend price State in year 1 in year 1 in year 1 in year 1 Recession $- $67.50 $1.65 $31.35 Normal $- $82.50 $1.65 $34.35 Boom $1.05 $96.45 $1.95 $19.05 Using the information above, answer parts a through f. [Hint: First, calculate the probability of each state (recession, normal, and boom). Second, calculate the holding period return of each asset (security A and security B) in each state (recession, normal, and boom). And then, you can solve parts a through f.] d. Calculate the expected percentage return and its standard deviation of a portfolio that invests equal amounts in security A and security B. e. Calculate the expected percentage return and its standard deviation of a portfolio that takes a short position in security A in the amount of $20,000 and a long position in security B in the amount of $120,000. f. Calculate the expected percentage return and its standard deviation of a portfolio that borrows $10,000 at the annual risk-free rate of 4%, and takes a short position in security B in the amount of $15,000 and a long position in security A in the amount of $75,000. Security A is currently priced at $75 per share and security B is currently priced at $30 per share. The economy can experience a recession, normal growth, or boom over the next year. The normal growth is eight times as likely as the recession and the boom is as likely as the recession. The table below presents the market-consensus per-share dividend and share price of each security in each state of the economy. Security A Security B Dividend Ex-dividend price Dividend Ex-dividend price State in year 1 in year 1 in year 1 in year 1 Recession $- $67.50 $1.65 $31.35 Normal $- $82.50 $1.65 $34.35 Boom $1.05 $96.45 $1.95 $19.05 Using the information above, answer parts a through f. [Hint: First, calculate the probability of each state (recession, normal, and boom). Second, calculate the holding period return of each asset (security A and security B) in each state (recession, normal, and boom). And then, you can solve parts a through f.] d. Calculate the expected percentage return and its standard deviation of a portfolio that invests equal amounts in security A and security B. e. Calculate the expected percentage return and its standard deviation of a portfolio that takes a short position in security A in the amount of $20,000 and a long position in security B in the amount of $120,000. f. Calculate the expected percentage return and its standard deviation of a portfolio that borrows $10,000 at the annual risk-free rate of 4%, and takes a short position in security B in the amount of $15,000 and a long position in security A in the amount of $75,000
Step by Step Solution
There are 3 Steps involved in it

Get step-by-step solutions from verified subject matter experts