

Question: Please help me solve Question no. 5 and 6. Consider a Melanesian island nation in the South Pacific, which had a population of 0.8 million
Please help me solve Question no. 5 and 6.
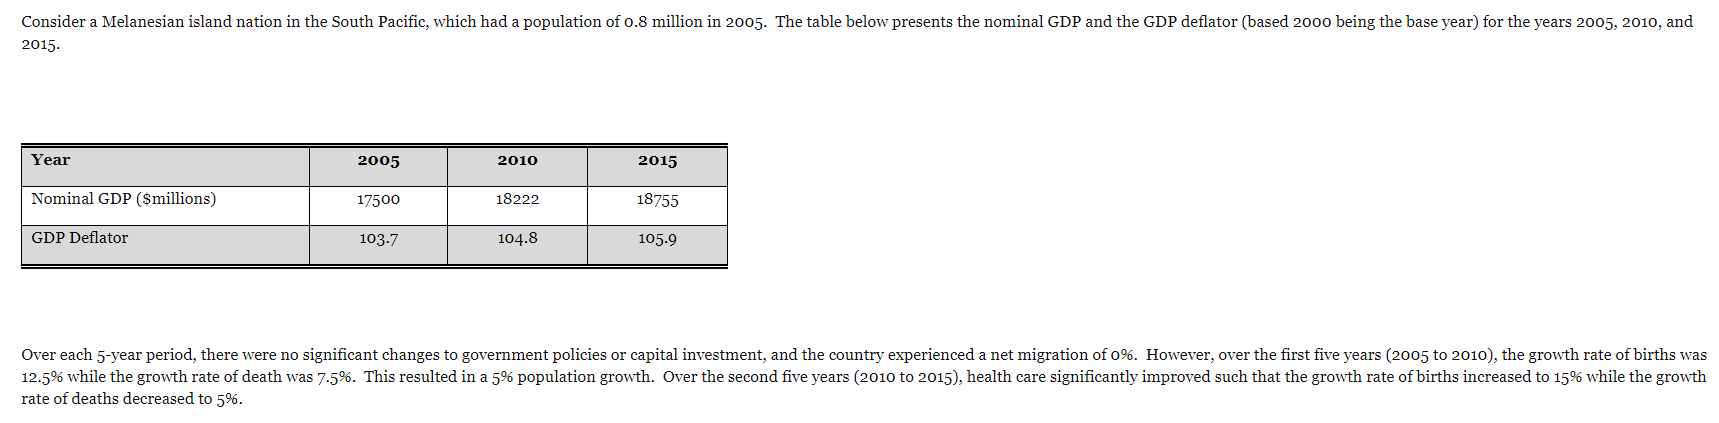
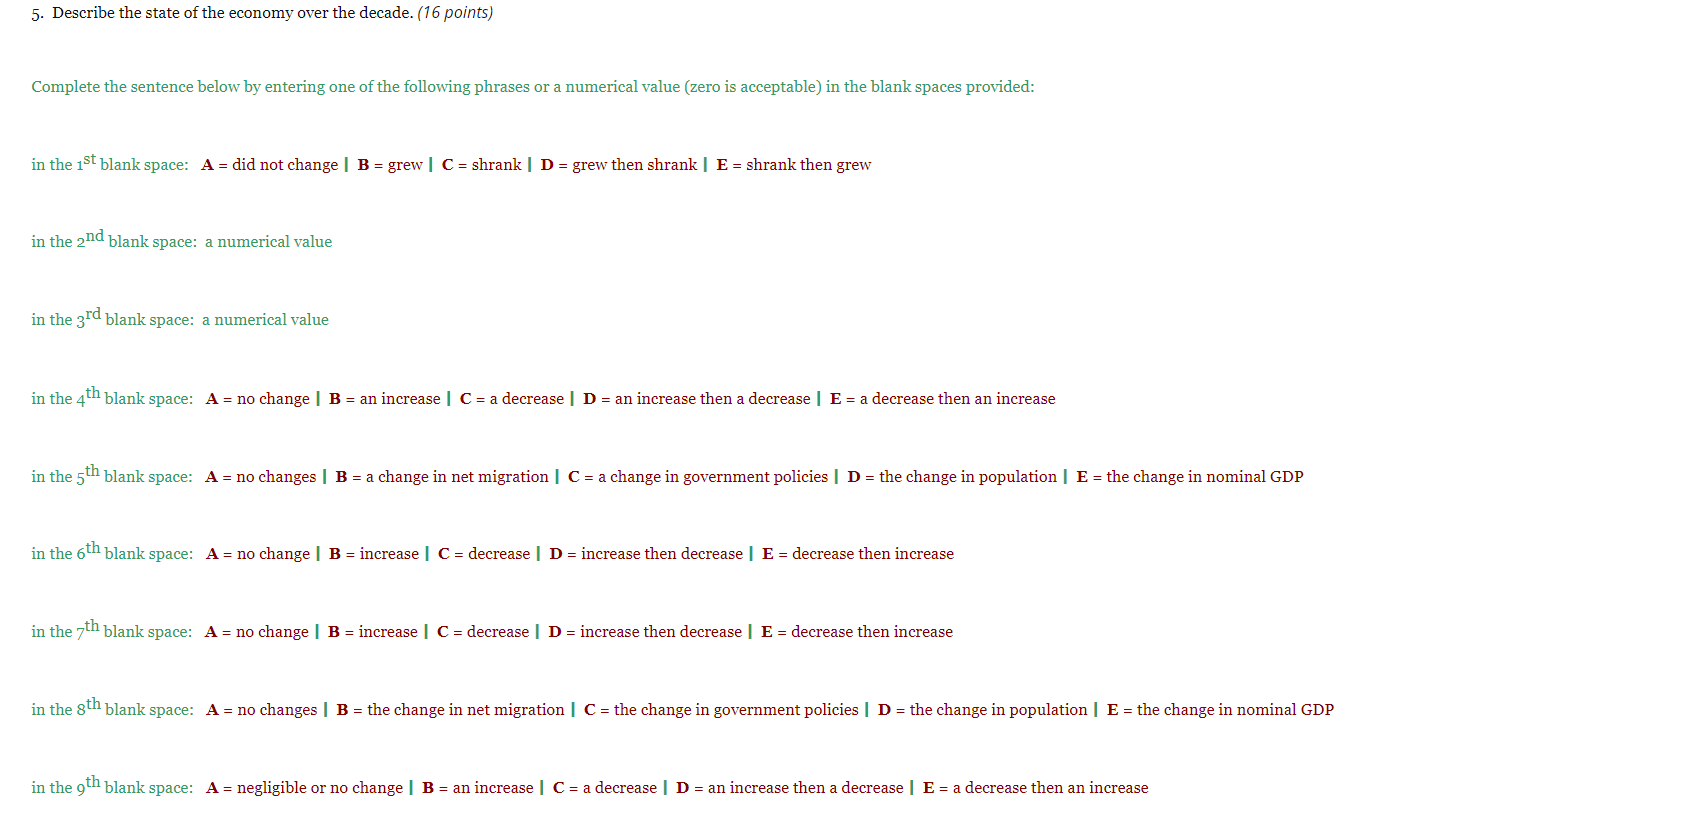

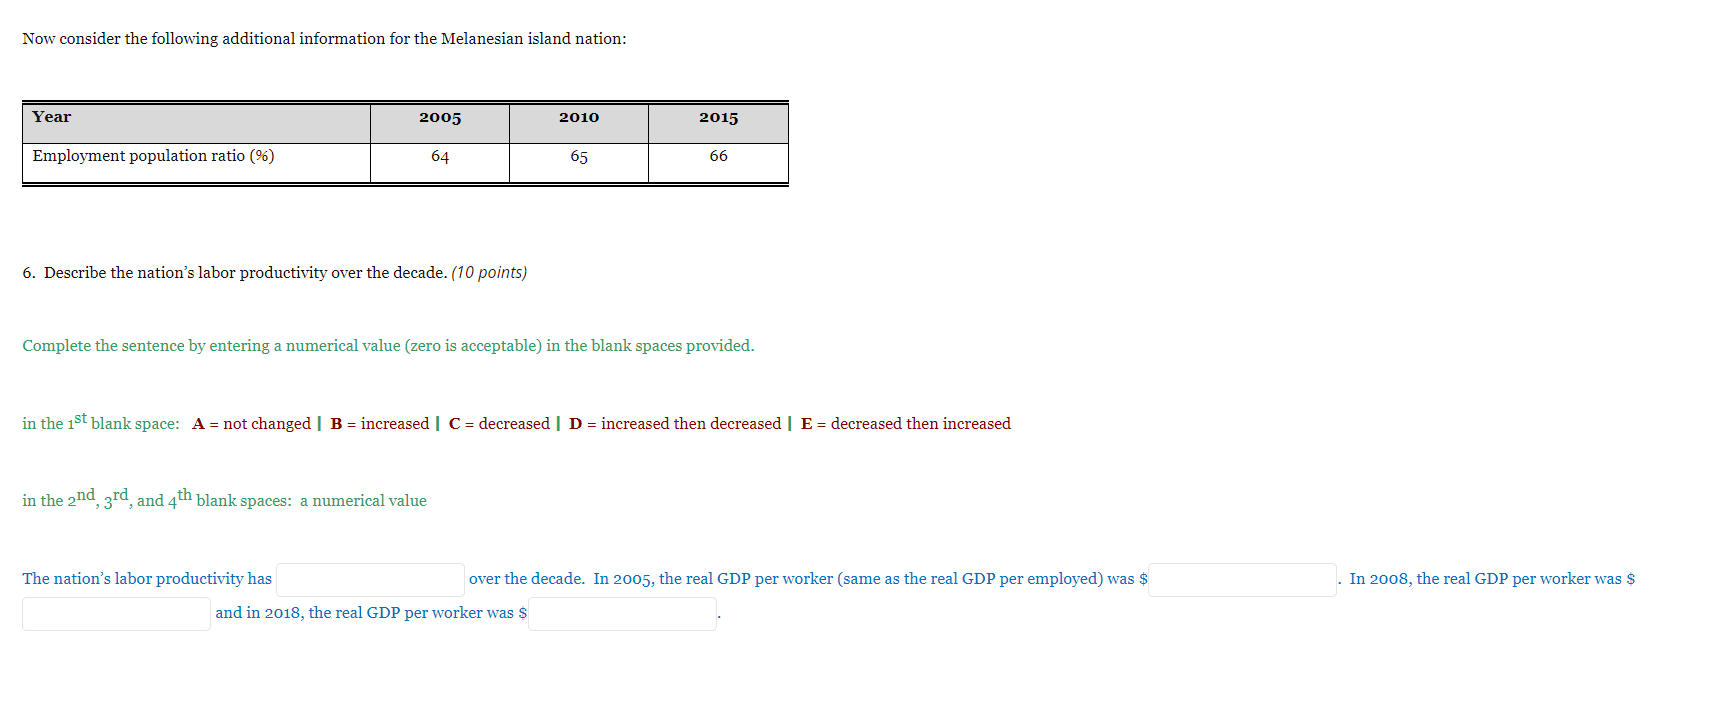
Consider a Melanesian island nation in the South Pacific, which had a population of 0.8 million in 2005. The table below presents the nominal GDP and the GDP deflator (based 2000 being the base year) for the years 2005, 2010, and 2015 Year 2005 2010 2015 Nominal GDP ($millions) 17500 18222 18755 GDP Deflator 103.7 104.8 105.9 Over each 5-year period, there were no significant changes to government policies or capital investment, and the country experienced a net migration of 0%. However, over the first five years (2005 to 2010), the growth rate of births was 12.5% while the growth rate of death was 7.5%. This resulted in a 5% population growth. Over the second five years (2010 to 2015), health care significantly improved such that the growth rate of births increased to 15% while the growth rate of deaths decreased to 5%. 5. Describe the state of the economy over the decade. (16 points) Complete the sentence below by entering one of the following phrases or a numerical value (zero is acceptable) in the blank spaces provided: in the 1st blank space: A = did not change B = grew | C = shrank | D = grew then shrank | E = shrank then grew in the 2nd blank space: a numerical value in the 3rd blank space: a numerical value in the 4th blank space: A = no change B = an increase | C = a decrease | D = an increase then a decrease | E = a decrease then an increase in the 5th blank space: A = no changes | B = a change in net migration | C = a change in government policies | D = the change in population | E = the change in nominal GDP in the 6th blank space: A = no change B = increase | C = decrease | D = increase then decrease | E = decrease then increase in the 7th blank space: A = no change B = increase C = decrease | D = increase then decrease E = decrease then increase in the 8th blank space: A = no changes | B = the change in net migration | C = the change in government policies | D = the change in population | E = the change in nominal GDP in the 9th blank space: A = negligible or no change B = an increase | C = a decrease | D = an increase then a decrease | E = a decrease then an increase in the 8th blank space: A = no changes | B = the change in net migration | C = the change in government policies | D = the change in population | E = the change in nominal GDP in the 9th blank space: A = negligible or no change B = an increase C = a decrease | D = an increase then a decrease | E = a decrease then an increase in the 10th blank space: A = negligible or no change B = an increase | C = a decrease | D = an increase then a decrease | E = a decrease then an increase The economy over the decade with economic growth rates of percent and average person experienced in their standard of living and this may be attributable to in the real output may be explained by that led to percent in the 5-year periods 2005 - 2010 and 2010 - 2015, respectively. The Furthermore, the in the price level and the in aggregate demand and in aggregate supply. Now consider the following additional information for the Melanesian island nation: Year 2005 2010 2015 Employment population ratio (9) 64 65 66 6. Describe the nation's labor productivity over the decade. (10 points) Complete the sentence by entering a numerical value (zero is acceptable) in the blank spaces provided. in the 1st blank space: A = not changed | B = increased | C = decreased | D = increased then decreased | E = decreased then increased in the 2nd 1 3rd, and 4th blank spaces: a numerical value In 2008, the real GDP per worker was $ The nation's labor productivity has over the decade. In 2005, the real GDP per worker (same as the real GDP per employed) was $ and in 2018, the real GDP per worker was $
Step by Step Solution
There are 3 Steps involved in it

Get step-by-step solutions from verified subject matter experts