

Question: Please help me solve sections a and b Could it be that smoking actually increases survival rates among women? The accompanying data represent the 20-year
Please help me solve sections a and b
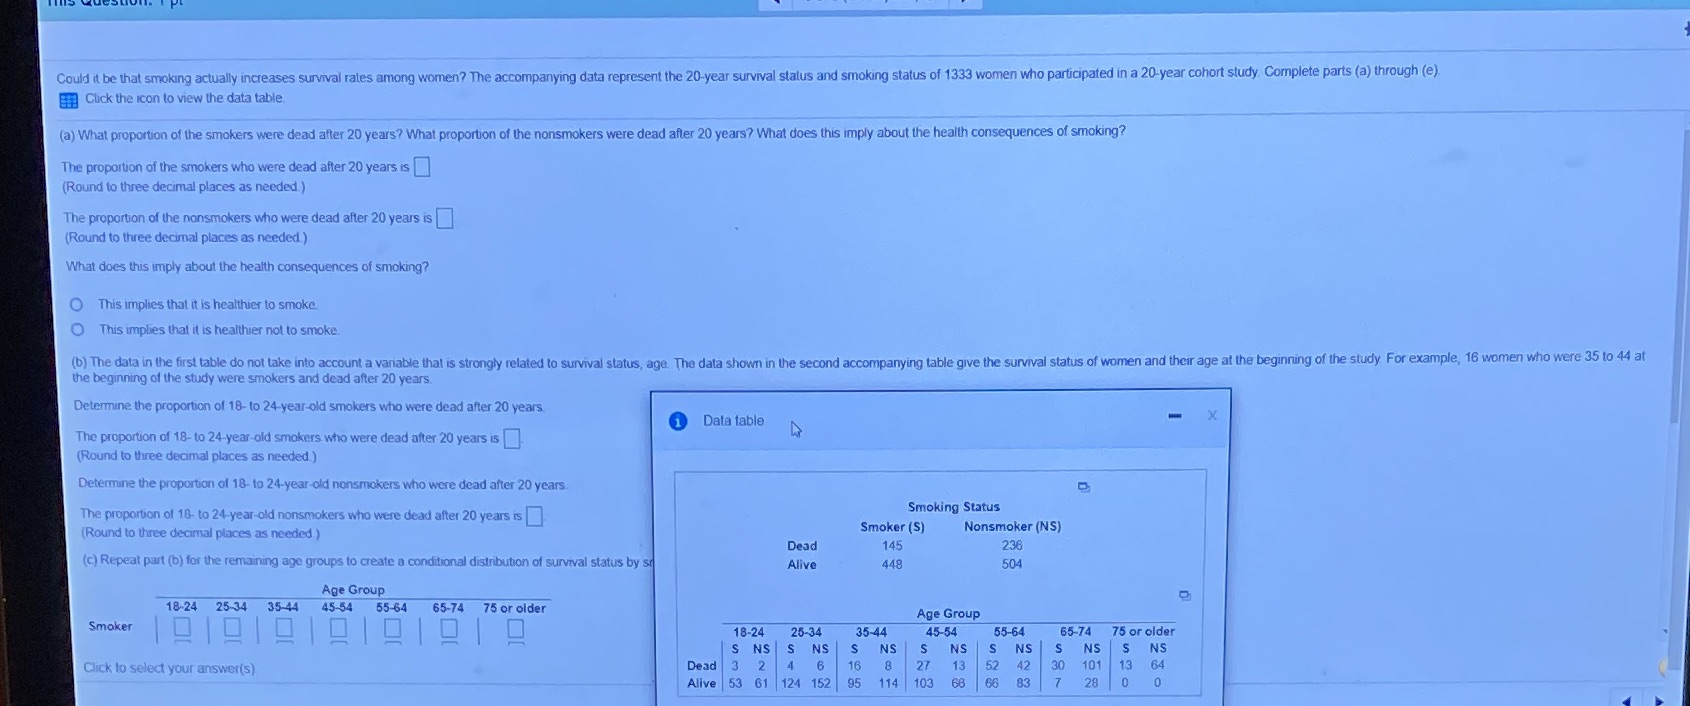
Could it be that smoking actually increases survival rates among women? The accompanying data represent the 20-year survival status and smoking status of 1333 women who participated in a 20-year cohort study, Complete parts (a) through (e) Click the icon to view the data table. (a) What proportion of the smokers were dead after 20 years? What proportion of the nonsmokers were dead after 20 years? What does this imply about the health consequences of smoking? The proportion of the smokers who were dead after 20 years is (Round to three decimal places as needed.) The proportion of the nonsmokers who were dead after 20 years is Round to three decimal places as needed) What does this imply about the health consequences of smoking? This implies that it is healthier to smoke. O This implies that it is healthier not to smoke. (b) The data in the first table do not take into account a variable that is strongly related to survival status, age. The data shown in the second accompanying table give the survival status of women and their age at the beginning of the study For example, 16 women who were 35 to 44 at the beginning of the study were smokers and dead after 20 years. Determine the proportion of 18- to 24-year-old smokers who were dead after 20 years. 1 Data table X The proportion of 18-to 24-year-old smokers who were dead after 20 years is (Round to three decimal places as needed.) Determine the proportion of 18- to 24-year-old nonsmokers who were dead after 20 years. The proportion of 18- to 24-year-old nonsmokers who were dead after 20 years is Smoking Status (Round to three decimal places as needed ) Smoker (S) Nonsmoker (NS) Dead 145 236 (c) Repeat part (b) for the remaining age groups to create a conditional distribution of survival status by s Alive 448 504 Age Group 18-24 25-34 3 45-54 55-64 65-74 75 or older Age Group Smoker 18-24 25-34 35-44 45-54 55-64 65-74 75 or older S NS S NS S NS S NS S NS S NS S NS Click to select your answer(s) Dead 3 2 16 27 13 42 30 101 13 64 Alive 53 61 124 152 95 114 103 68 66 83 28 0
Step by Step Solution
There are 3 Steps involved in it

Get step-by-step solutions from verified subject matter experts