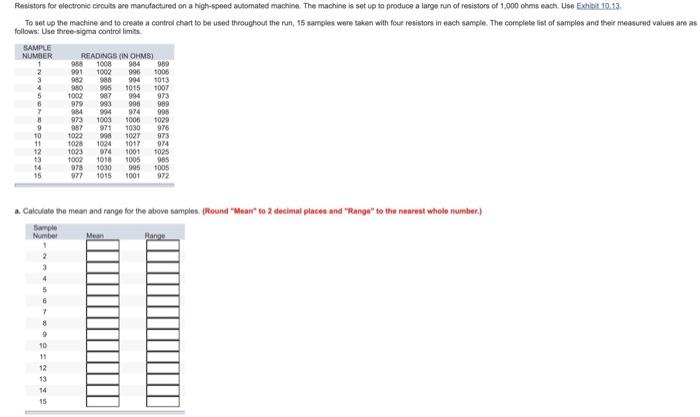
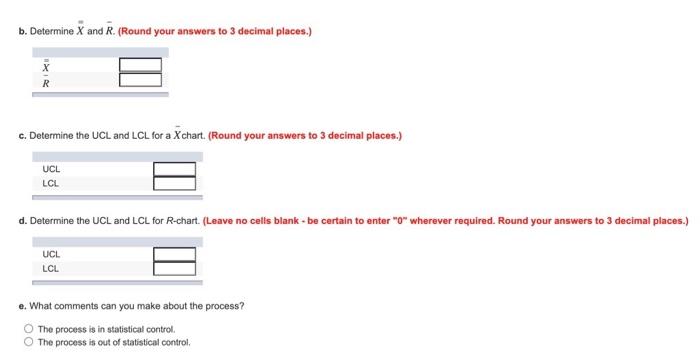
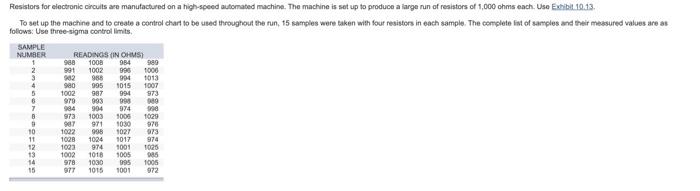
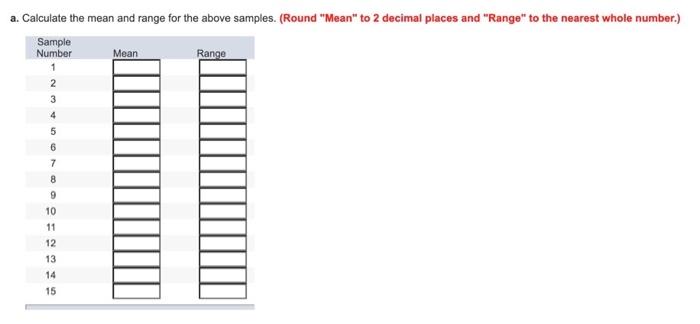
Question: Please help me solve, thank you (: I will thumbs up if correct 954 998 Resistors for electronic circuits are manufactured on a high-speed automated

Please help me solve, thank you (:
I will thumbs up if correct
Please help me solve, thank you (: I will thumbs
954 998 Resistors for electronic circuits are manufactured on a high-speed automated machine. The machine is set up to produce a large run of resistors of 1,000 ohms each. Use Exhibit 10.13. To set up the machine and to create a control chart to be used throughout the run, 15 samples were taken with four resistors in each sample. The complete list of samples and their measured values are as follows: Use three-sigma controllimits. SAMPLE NUMBER READINGS (IN OHMS) 988 1008 980 1 9911002 1000 982 904 1013 980 995 1015 1007 973 979 993 989 7 984 994 974 990 973 1003 1006 1029 27 971 1030 976 1022 998 1027 973 1028 1024 1017 974 12 1023 974 1001 1025 13 1018 1005 14 978 1030 1005 15 977 1015 1001 4 5 8 9 1002 098 B 0 10 11 1008 985 a. Calculate the mean and range for the above samples. Round "Maan" to 2 decimal places and "Mango" to the nearest whole number.) ople Number Mean 2 3 4 5 6 7 8 9 10 11 12 53 14 15 b. Determine X and R. (Round your answers to 3 decimal places.) c. Determine the UCL and LCL for a Xchart. (Round your answers to 3 decimal places.) UCL LCL d. Determine the UCL and LCL for R-chart (Leave no cells blank - be certain to enter "o" wherever required. Round your answers to 3 decimal places.) UCL LCL e. What comments can you make about the process? The process is in statistical control The process is out of statistical control, Resistors for electronic circuits are manufactured on a high-speed automated machine. The machine is set up to produce a large nun of resistors of 1,000 ohms each. Use Exhibit 10.13. To set up the machine and to create a control chart to be used throughout the run, 15 samples were taken with four resistors in each sample. The complete list of samples and their measured values are as follows: Use three-sigma controllimit SAMPLE NUMBER READINGS (IN OHMS) 1 988 1008 954 980 2 991 1002 990 1000 942 988 994 1013 4 980 995 1015 1007 5 1002 987 9944 973 970 993 998 080 7 984 904 974 972 1003 907 971 1030 978 10 1022 906 973 1028 1024 1017 974 1023 974 1001 1025 13 1002 1010 5005 085 978 1030 995 1005 977 1015 1001 972 1005 1029 1027 11 12 14 a. Calculate the mean and range for the above samples. (Round "Mean" to 2 decimal places and "Range" to the nearest whole number.) Sample Number Range Mean 1 2 3 4 5 6 7 8 9 10 11 12 13 14 15 b. Determine X and R. (Round your answers to 3 decimal places.) c. Determine the UCL and LCL for a Xchart. (Round your answers to 3 decimal places.) UCL. LCL d. Determine the UCL and LCL for R.chart (Leave no cells blank - be certain to enter "o" wherever required. Round your answers to 3 decimal places.) UCL LCL .. What comments can you make about the process? The process is in statistical control. The process is out of statistical control

Step by Step Solution

There are 3 Steps involved in it

1 Expert Approved Answer
Step: 1 Unlock blur-text-image
Question Has Been Solved by an Expert!

Get step-by-step solutions from verified subject matter experts

Step: 2 Unlock
Step: 3 Unlock

Students Have Also Explored These Related General Management Questions!