

Question: Please help me solve the error to this Matlab question 2D. Image transcription text Consider a system similar to that considered in Problem 1 but
Please help me solve the error to this Matlab question 2D.
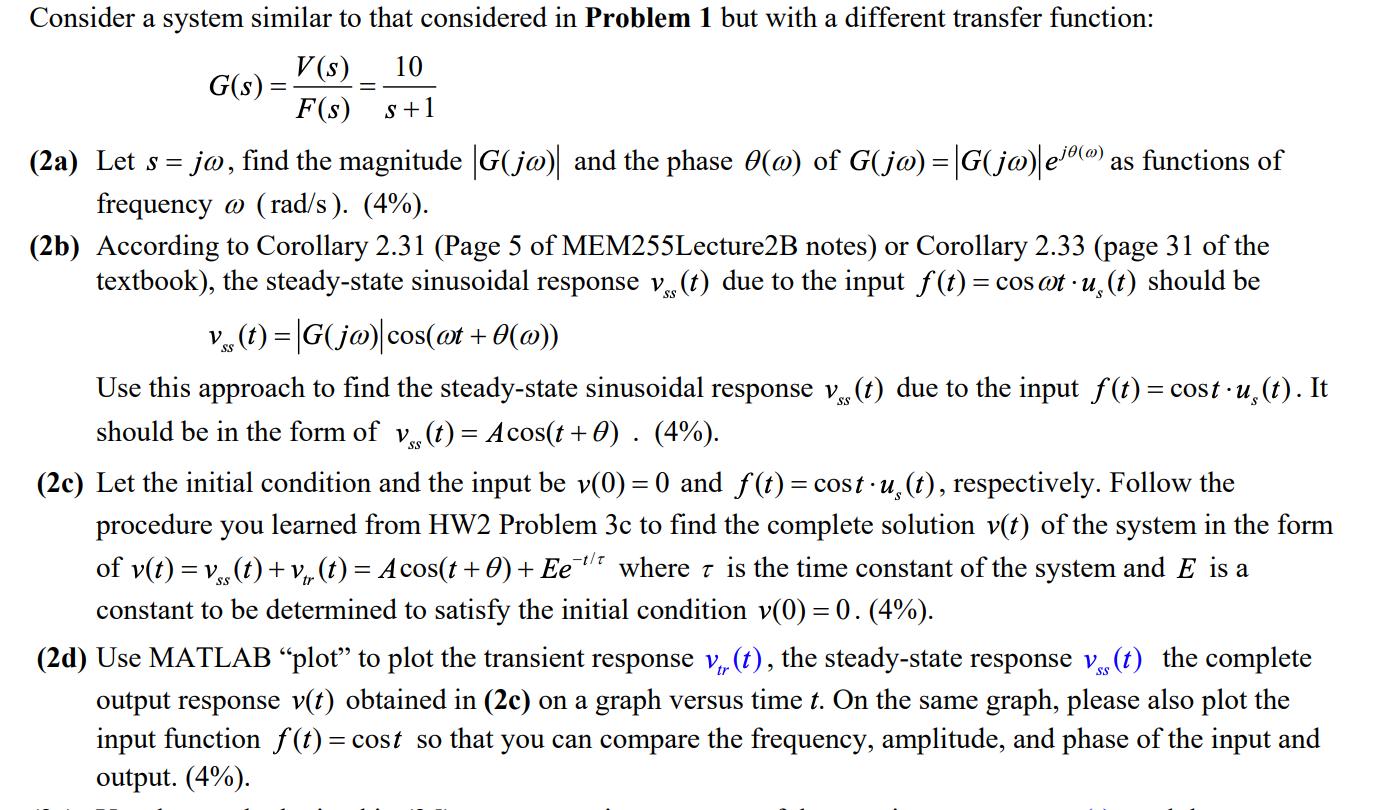
Image transcription text
Consider a system similar to that considered in Problem 1 but with a different transfer function: V(s) 10G(s) = F(s) s+1 (2a) Let s = jo, find the magnitude G(jw) and the phase O(@) of G(jw) = G(jw) e/@ as
functions of frequency @ (rad/s ). (4%). (2b) According to Corollary 2.31 (Page 5 of MEM2...
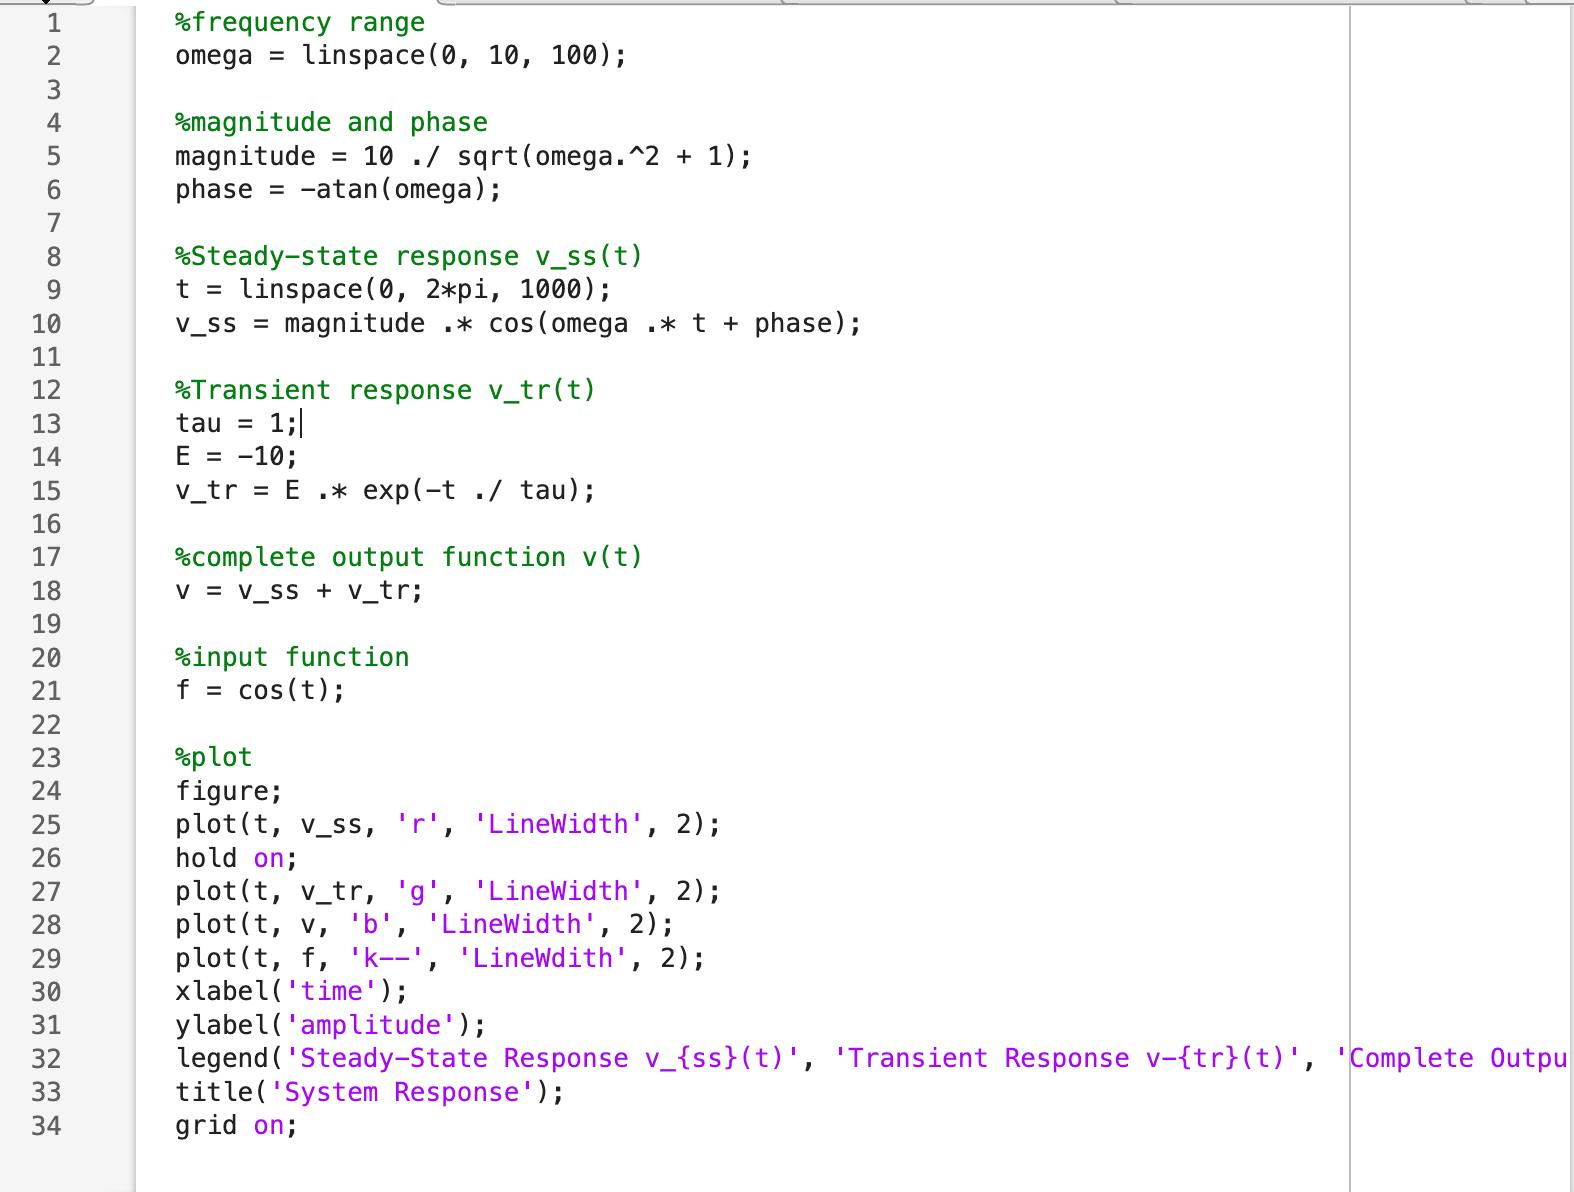
Image transcription text
frequency range omega = linspace(0, 10, 100); OUTA WNY %magnitude and phase magnitude = 10 . /sqrt(omega. ^2 + 1); phase = -atan (omega) ; 6 00 V .Steady-state response v_ss(t) t = linspace(0, 2*pi,
1000); 10 v_ss = magnitude .* cos (omega . * t + phase) ; 11 12 Transient response v_tr(t) 13 ...

Image transcription text
Error in Problem20 graph (line 10) v_ss = magnitude . * cos (omega . * t + phase); Relateddocumentation
the code is:
%frequency range
omega = linspace(0, 10, 100);
%magnitude and phase
magnitude = 10 ./ sqrt(omega.^2 + 1);
phase = -atan(omega);
%Steady-state response v_ss(t)
t = linspace(0, 2*pi, 1000);
v_ss = magnitude .* cos(omega .* t + phase);
%Transient response v_tr(t)
tau = 1;
E = -10;
v_tr = E .* exp(-t ./ tau);
%complete output function v(t)
v = v_ss + v_tr;
%input function
f = cos(t);
%plot
figure;
plot(t, v_ss, 'r', 'LineWidth', 2);
hold on;
plot(t, v_tr, 'g', 'LineWidth', 2);
plot(t, v, 'b', 'LineWidth', 2);
plot(t, f, 'k--', 'LineWdith', 2);
xlabel('time');
ylabel('amplitude');
legend('Steady-State Response v_{ss}(t)', 'Transient Response v-{tr}(t)', 'Complete Output Response v(t)', 'Input f(t) = cost(t)');
title('System Response');
grid on;
Consider a system similar to that considered in Problem 1 but with a different transfer function: G(s) = V(s) F(s) 10 s+1 (2a) Let s = = jo, find the magnitude |G(jw) and the phase (@) of G(jw) = |G(jw)|e() as functions of frequency @ (rad/s). (4%). (2b) According to Corollary 2.31 (Page 5 of MEM255Lecture2B notes) or Corollary 2.33 (page 31 of the textbook), the steady-state sinusoidal response vs (t) due to the input f (t) = cos at us (t) should be V(t) = |G(jw)|cos(@t + O(@)) Use this approach to find the steady-state sinusoidal response vs. (t) due to the input f(t) = cost u(t). It should be in the form of v(t) = Acos(t+0). (4%). (2c) Let the initial condition and the input be v(0) = 0 and f(t) = cost us (t), respectively. Follow the procedure you learned from HW2 Problem 3c to find the complete solution v(t) of the system in the form of v(t) = v(t) + v (t) = Acos(t + 0) + Ee where is the time constant of the system and E is a constant to be determined to satisfy the initial condition v(0) = 0. (4%). tr (2d) Use MATLAB "plot" to plot the transient response v, (t), the steady-state response vs (t) the complete output response v(t) obtained in (2c) on a graph versus time t. On the same graph, please also plot the input function f(t) = cost so that you can compare the frequency, amplitude, and phase of the input and output. (4%).
Step by Step Solution
There are 3 Steps involved in it

Get step-by-step solutions from verified subject matter experts