

Question: Please help me solve these problems, I genuinely appreciate it! What is your family's annual income ($)? international students: $0$70000$80000$100,000$120,000$700000 local students: $0$0$18000$20000$20000$30000$40,000$50000$50000$60000$70000$70,000 $80000$80,000$80000$95,000$98,000$100,000$100000$120,000$130000$130,000 $150,000$150000$200000$200000$200,000$400,000$800,000
Please help me solve these problems, I genuinely appreciate it!
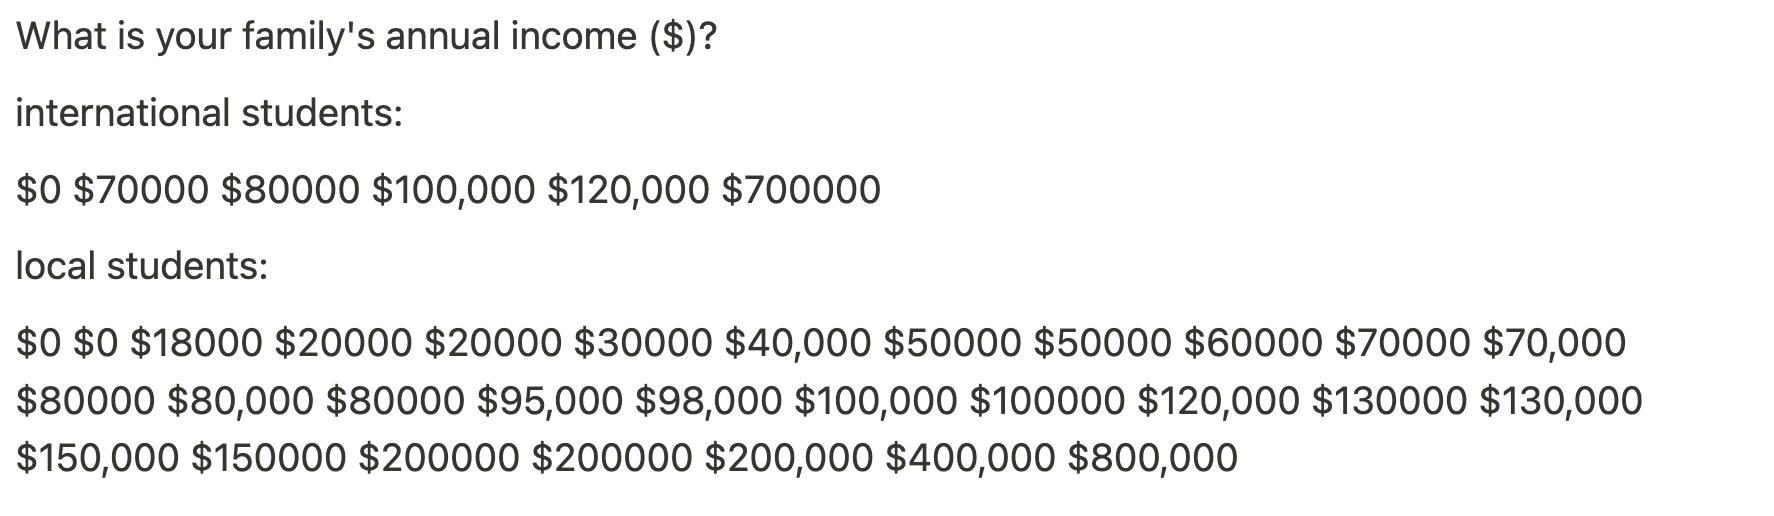
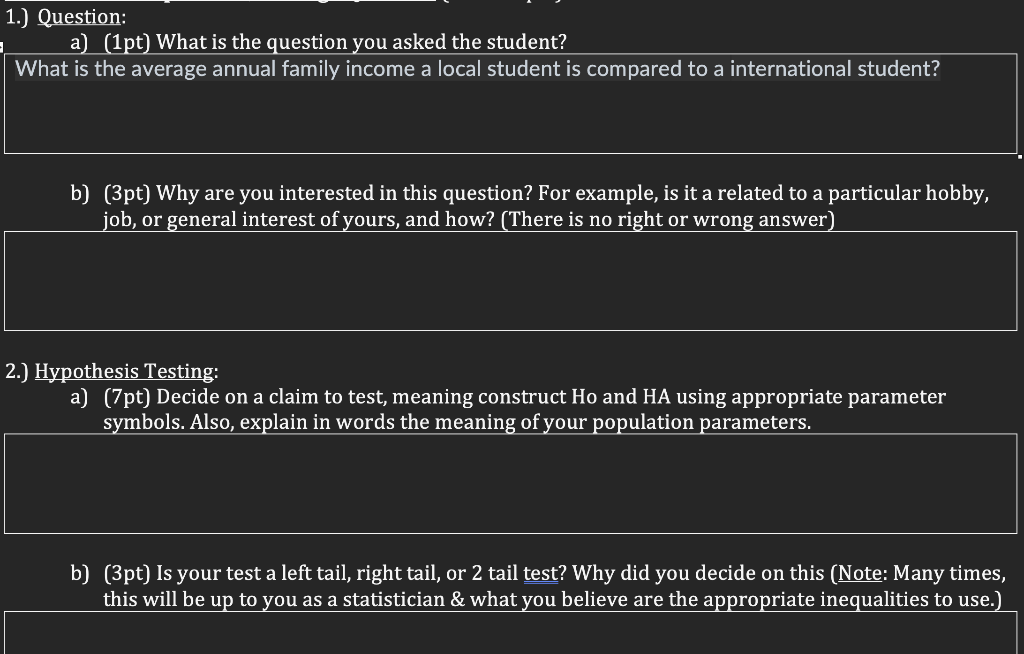
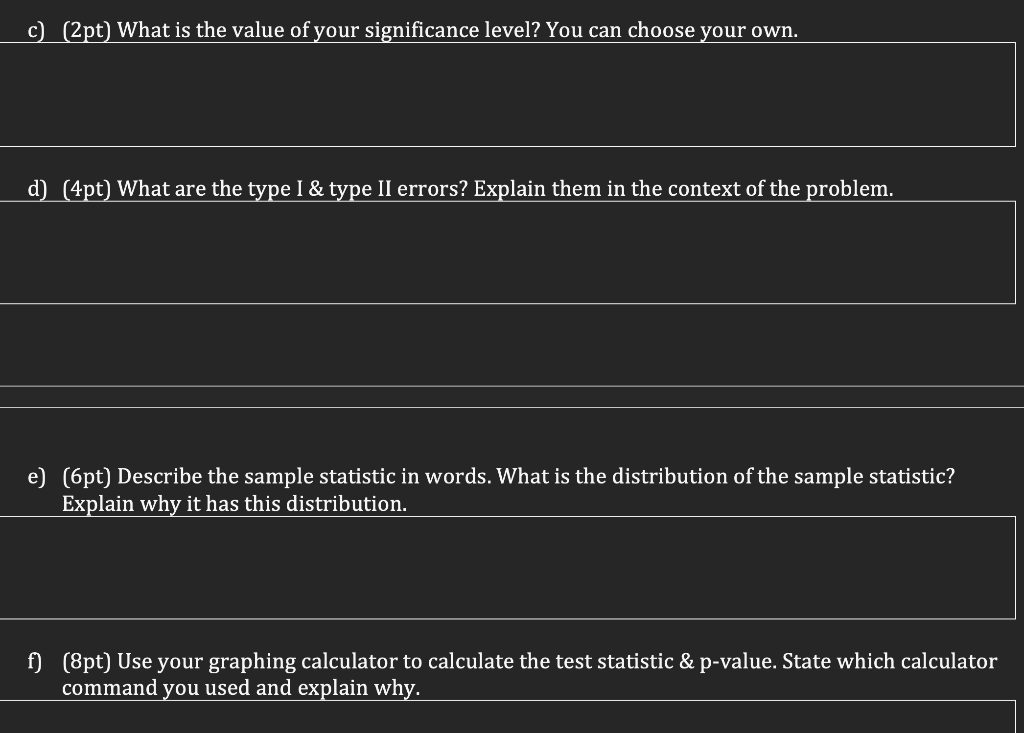
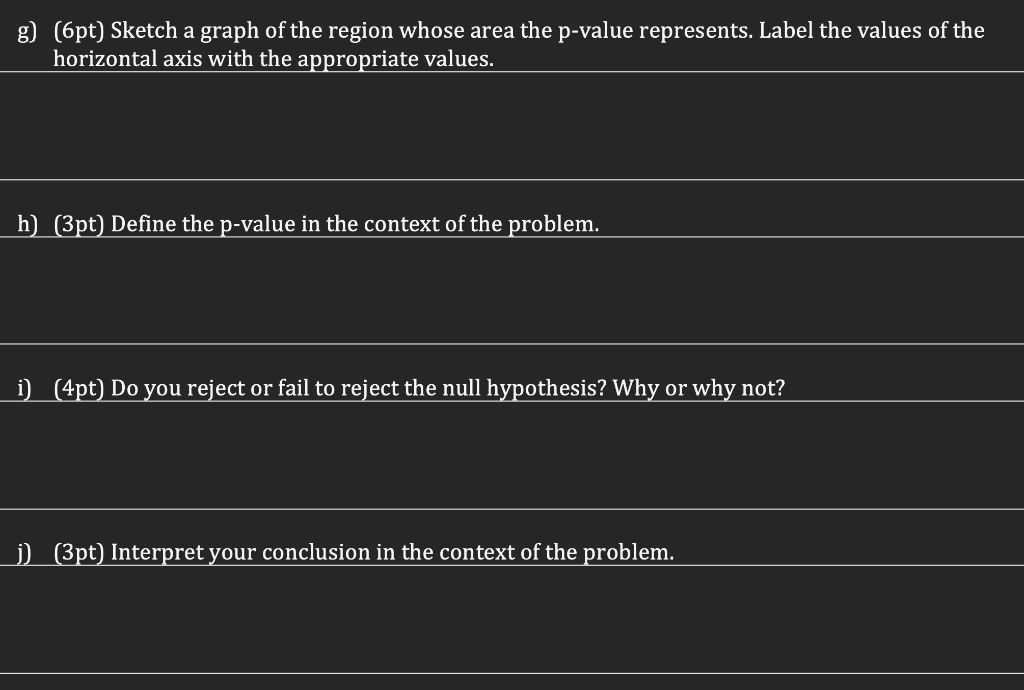
What is your family's annual income (\$)? international students: $0$70000$80000$100,000$120,000$700000 local students: $0$0$18000$20000$20000$30000$40,000$50000$50000$60000$70000$70,000 $80000$80,000$80000$95,000$98,000$100,000$100000$120,000$130000$130,000 $150,000$150000$200000$200000$200,000$400,000$800,000 a) (1pt) What is the question you asked the student? What is the average annual family income a local student is compared to a international student? b) (3pt) Why are you interested in this question? For example, is it a related to a particular hobby, job, or general interest of yours, and how? (There is no right or wrong answer) Hypothesis Testing: a) (7pt) Decide on a claim to test, meaning construct Ho and HA using appropriate parameter symbols. Also, explain in words the meaning of your population parameters. b) (3pt) Is your test a left tail, right tail, or 2 tail test? Why did you decide on this (Note: Many time this will be up to you as a statistician \& what you believe are the appropriate inequalities to use. c) (2pt) What is the value of your significance level? You can choose your own. d) (4pt) What are the type I \& type II errors? Explain them in the context of the problem. e) (6pt) Describe the sample statistic in words. What is the distribution of the sample statistic? Explain why it has this distribution. f) (8pt) Use your graphing calculator to calculate the test statistic \& p-value. State which calculator command you used and explain why. g) (6pt) Sketch a graph of the region whose area the p-value represents. Label the values of the horizontal axis with the appropriate values. h) (3pt) Define the p-value in the context of the problem. i) (4pt) Do you reject or fail to reject the null hypothesis? Why or why not? j) (3pt) Interpret your conclusion in the context of the problem. What is your family's annual income (\$)? international students: $0$70000$80000$100,000$120,000$700000 local students: $0$0$18000$20000$20000$30000$40,000$50000$50000$60000$70000$70,000 $80000$80,000$80000$95,000$98,000$100,000$100000$120,000$130000$130,000 $150,000$150000$200000$200000$200,000$400,000$800,000 a) (1pt) What is the question you asked the student? What is the average annual family income a local student is compared to a international student? b) (3pt) Why are you interested in this question? For example, is it a related to a particular hobby, job, or general interest of yours, and how? (There is no right or wrong answer) Hypothesis Testing: a) (7pt) Decide on a claim to test, meaning construct Ho and HA using appropriate parameter symbols. Also, explain in words the meaning of your population parameters. b) (3pt) Is your test a left tail, right tail, or 2 tail test? Why did you decide on this (Note: Many time this will be up to you as a statistician \& what you believe are the appropriate inequalities to use. c) (2pt) What is the value of your significance level? You can choose your own. d) (4pt) What are the type I \& type II errors? Explain them in the context of the problem. e) (6pt) Describe the sample statistic in words. What is the distribution of the sample statistic? Explain why it has this distribution. f) (8pt) Use your graphing calculator to calculate the test statistic \& p-value. State which calculator command you used and explain why. g) (6pt) Sketch a graph of the region whose area the p-value represents. Label the values of the horizontal axis with the appropriate values. h) (3pt) Define the p-value in the context of the problem. i) (4pt) Do you reject or fail to reject the null hypothesis? Why or why not? j) (3pt) Interpret your conclusion in the context of the
Step by Step Solution
There are 3 Steps involved in it

Get step-by-step solutions from verified subject matter experts