

Question: Please help me solve these thank you so much !!! *6.5. This problem is based on data published in 1903 by Karl Pearson and Alice
Please help me solve these thank you so much !!!
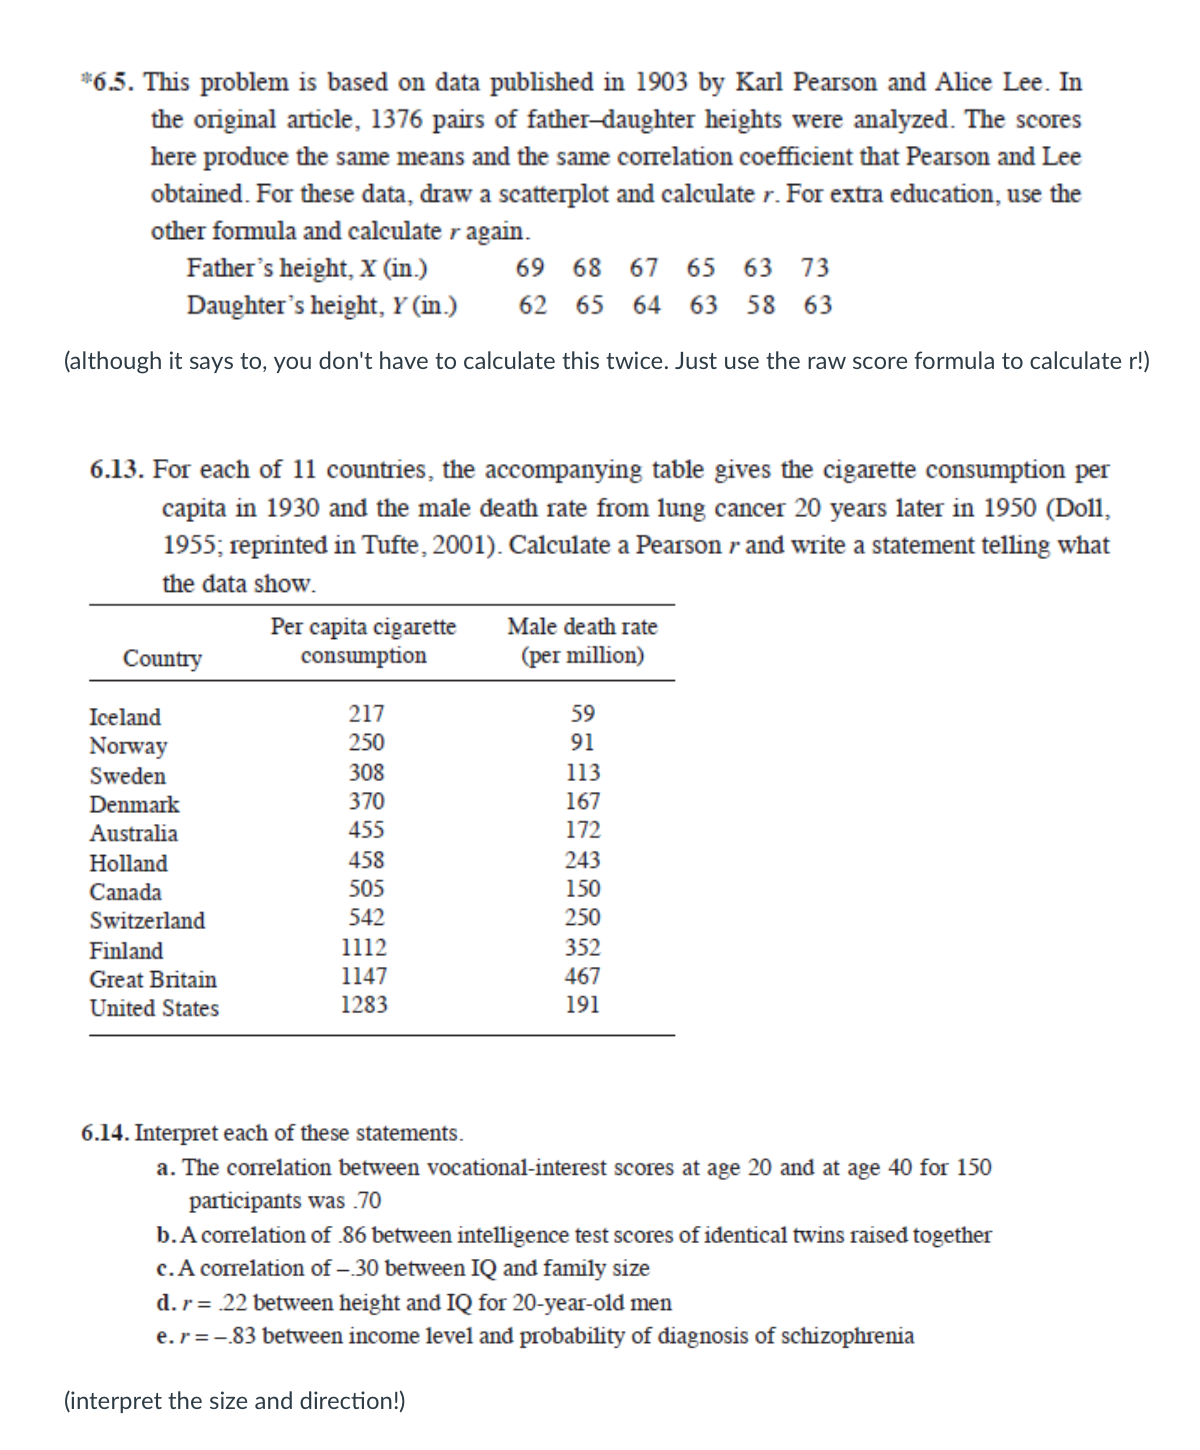
*6.5. This problem is based on data published in 1903 by Karl Pearson and Alice Lee. In the original article, 1376 pairs of father-daughter heights were analyzed. The scores here produce the same means and the same correlation coefficient that Pearson and Lee obtained. For these data, draw a scatterplot and calculate r. For extra education, use the other formula and calculate r again. Father's height, X (in.) 69 68 67 65 63 73 Daughter's height, Y (in.) 62 65 64 63 58 63 (although it says to, you don't have to calculate this twice. Just use the raw score formula to calculate r!) 6.13. For each of 11 countries, the accompanying table gives the cigarette consumption per capita in 1930 and the male death rate from lung cancer 20 years later in 1950 (Doll, 1955; reprinted in Tufte, 2001). Calculate a Pearson r and write a statement telling what the data show. Per capita cigarette Male death rate Country consumption (per million) Iceland 217 59 Norway 250 91 Sweden 308 113 Denmark 370 167 Australia 455 172 Holland 458 243 Canada 505 150 Switzerland 542 250 Finland 1112 352 Great Britain 1147 467 United States 1283 191 6.14. Interpret each of these statements. a. The correlation between vocational-interest scores at age 20 and at age 40 for 150 participants was .70 b. A correlation of .86 between intelligence test scores of identical twins raised together c. A correlation of -30 between IQ and family size d. r= .22 between height and IQ for 20-year-old men e. r=-.83 between income level and probability of diagnosis of schizophrenia (interpret the size and direction!)
Step by Step Solution
There are 3 Steps involved in it

Get step-by-step solutions from verified subject matter experts