

Question: Please help me solve these two math precalc questions POSSIBLE POINTS: 25 The chart below shows the number of daily newspapers published in the United

Please help me solve these two math precalc questions


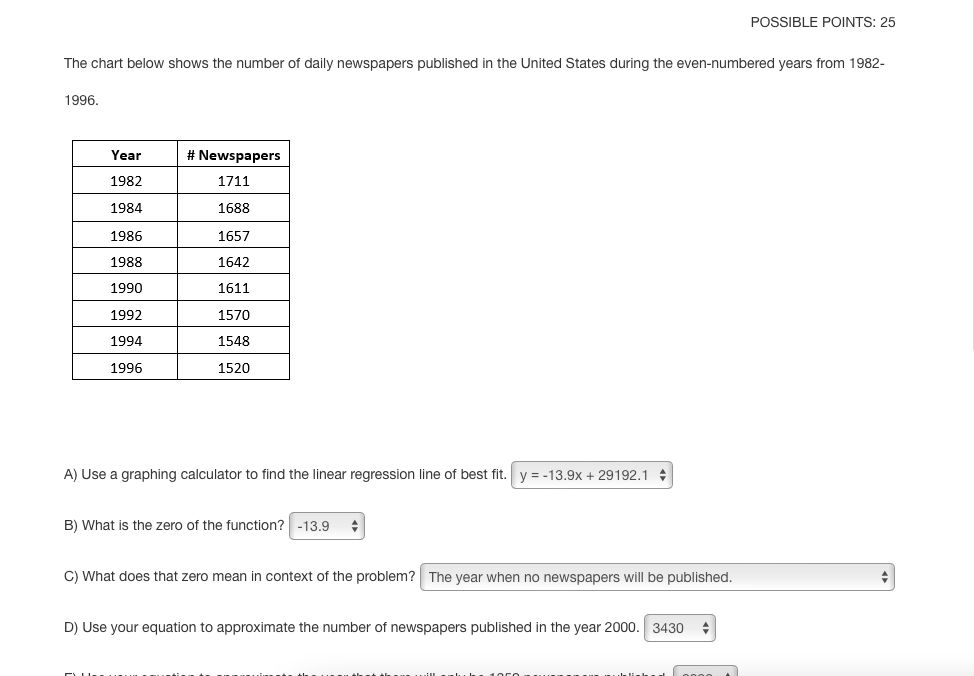
POSSIBLE POINTS: 25 The chart below shows the number of daily newspapers published in the United States during the even-numbered years from 1982- 1996. Year # Newspapers 1982 1711 1984 1688 1986 1657 1988 1642 1990 1611 1992 1570 1994 1548 1996 1520 A) Use a graphing calculator to find the linear regression line of best fit. y = -13.9x + 29192.1 # B) What is the zero of the function? -13.9 C) What does that zero mean in context of the problem?| The year when no newspapers will be published. D) Use your equation to approximate the number of newspapers published in the year 2000. 3430
Step by Step Solution
There are 3 Steps involved in it

Get step-by-step solutions from verified subject matter experts