

Question: Please help me solve this Data enrolled students. Both have grown significantly over the years. She collects the following data. (Click the icon to view
 Please help me solve this
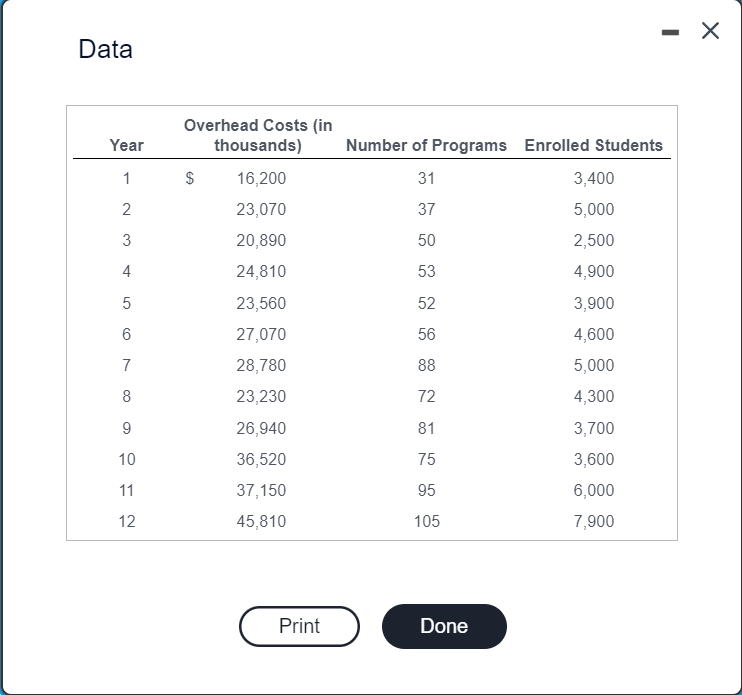
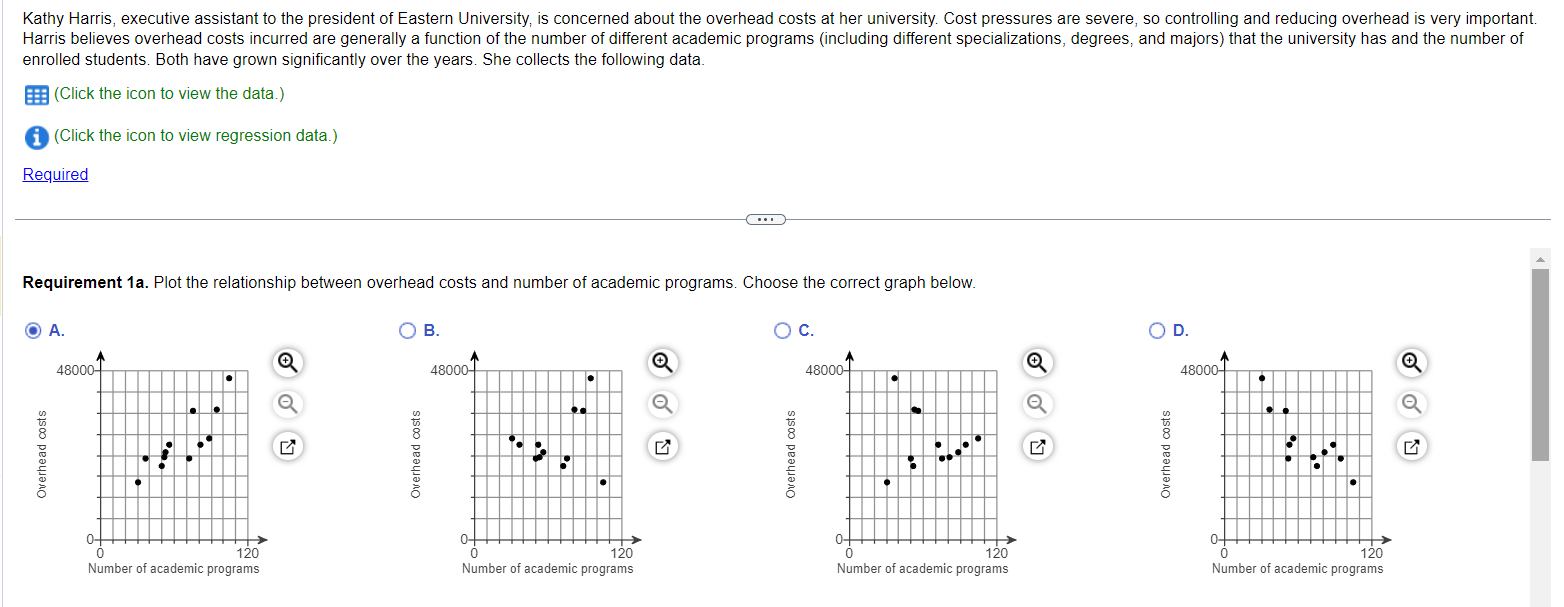
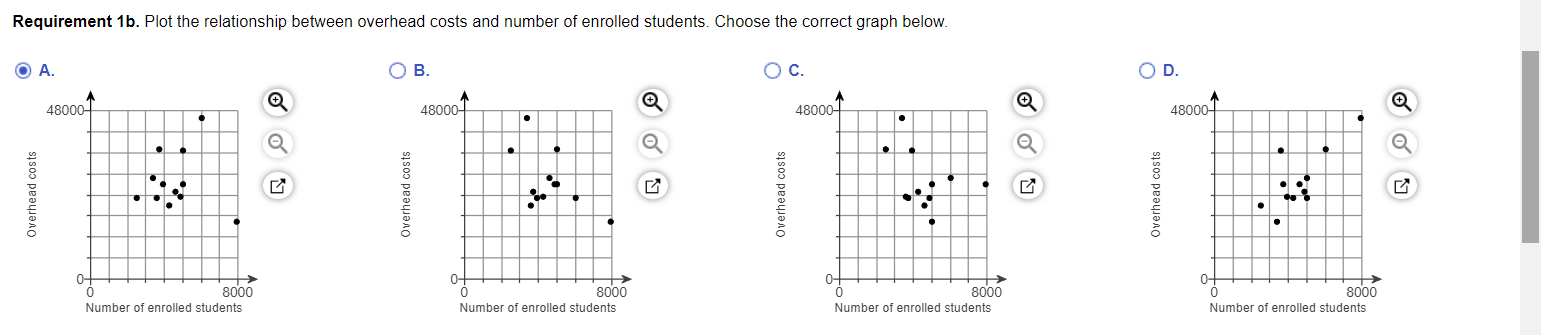
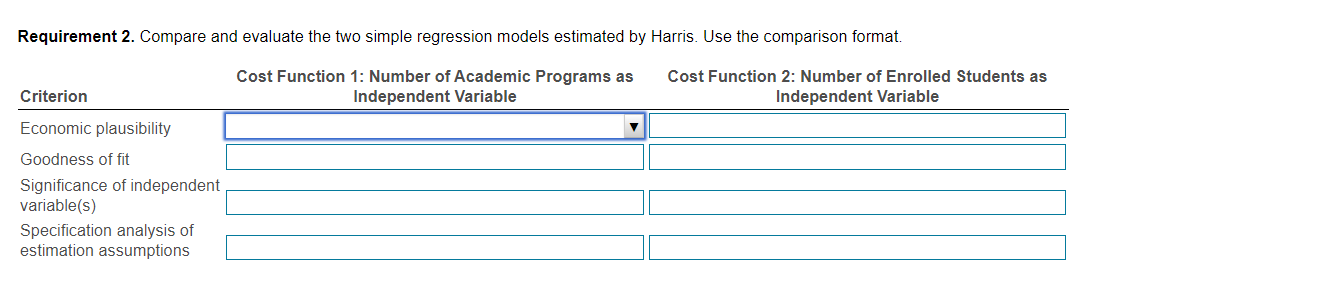
Data enrolled students. Both have grown significantly over the years. She collects the following data. (Click the icon to view the data.) (Click the icon to view regression data.) Requirement 1a. Plot the relationship between overhead costs and number of academic programs. Choose the correct graph below. A. B. Requirement 1b. Plot the relationship between overhead costs and number of enrolled students. Choose the correct graph below. B. c. n Requirement 2. Compare and evaluate the two simple regression models estimated by Harris. Use the comparison format
Step by Step Solution
There are 3 Steps involved in it
1 Expert Approved Answer
Step: 1 Unlock

Question Has Been Solved by an Expert!
Get step-by-step solutions from verified subject matter experts
Step: 2 Unlock
Step: 3 Unlock