

Question: please help me solve this homework, follow the instructions correctly, and work on it in Excel by providing the formulas while it is being solved,


please help me solve this homework, follow the instructions correctly, and work on it in Excel by providing the formulas while it is being solved, thank you in advance. it is due tonight so please please help me submit it on time

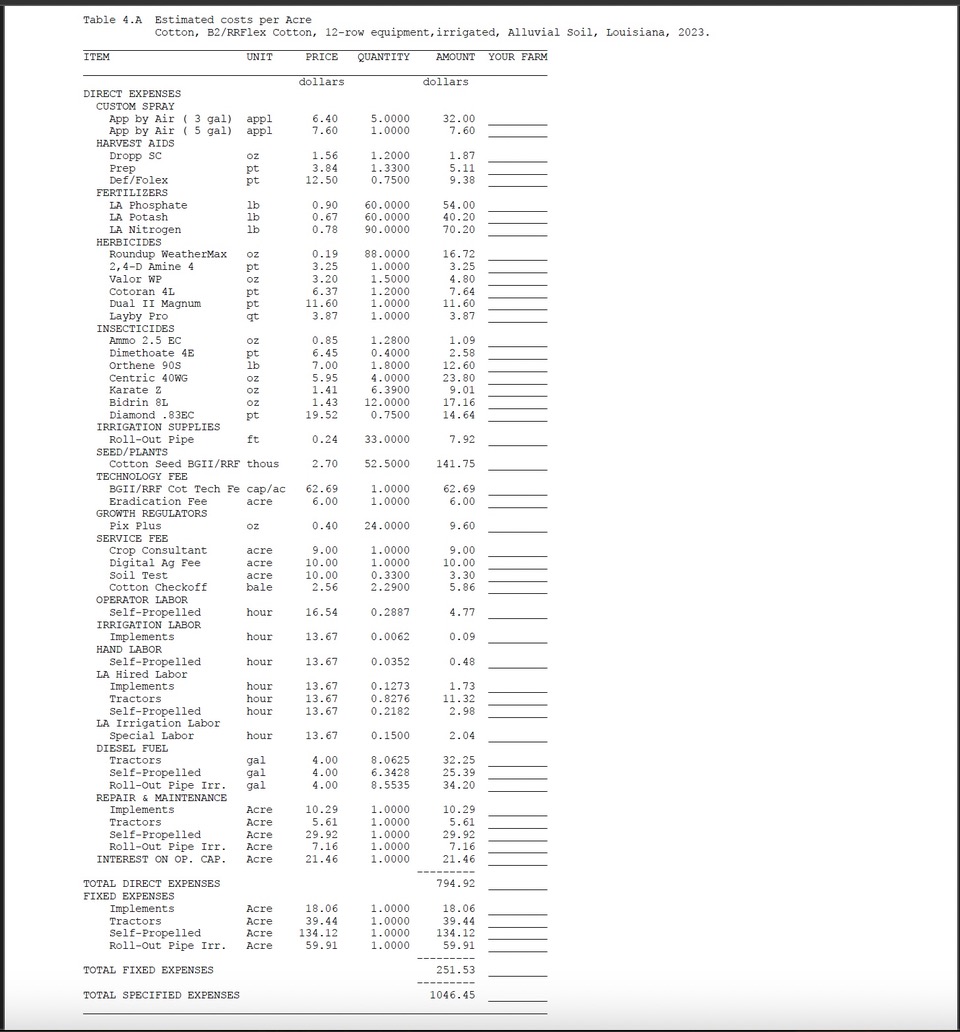

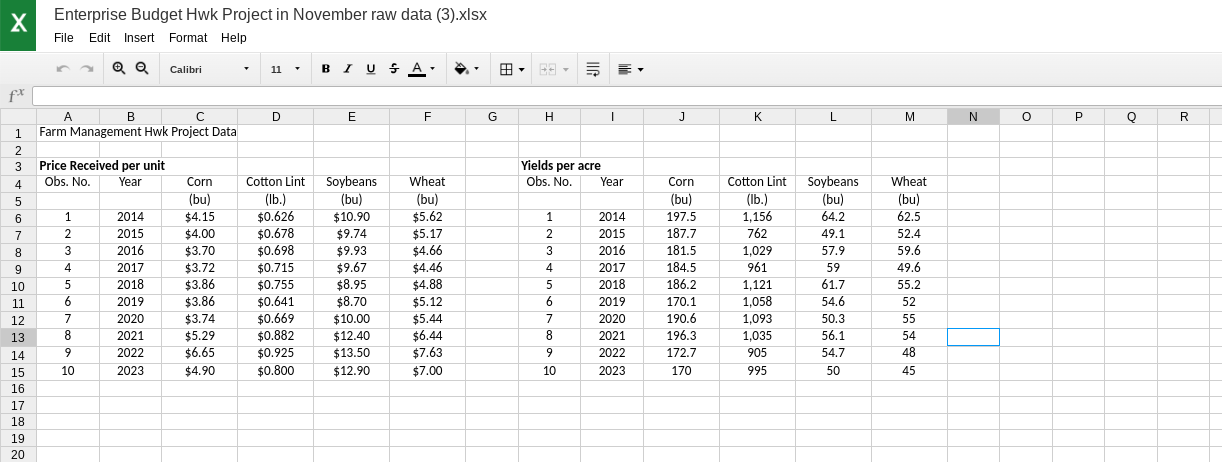

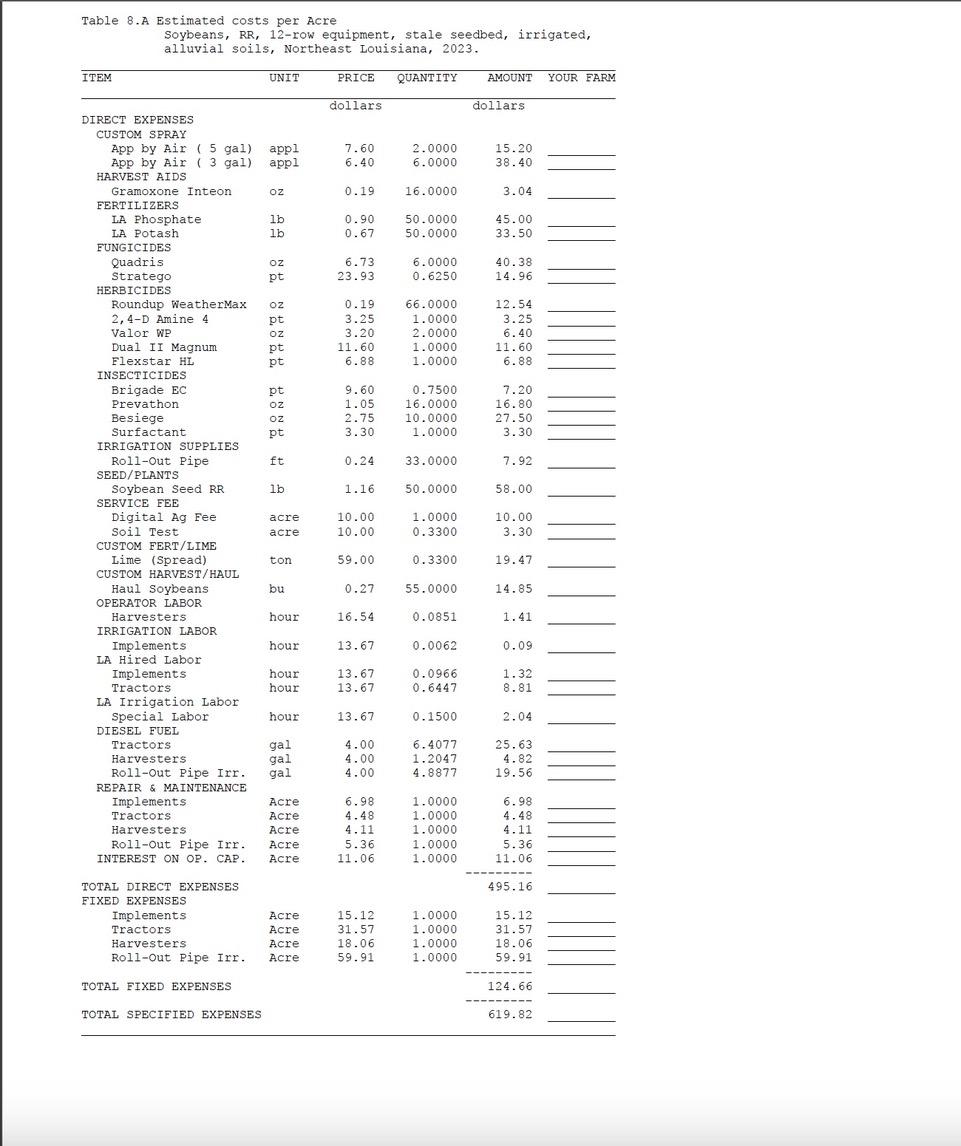
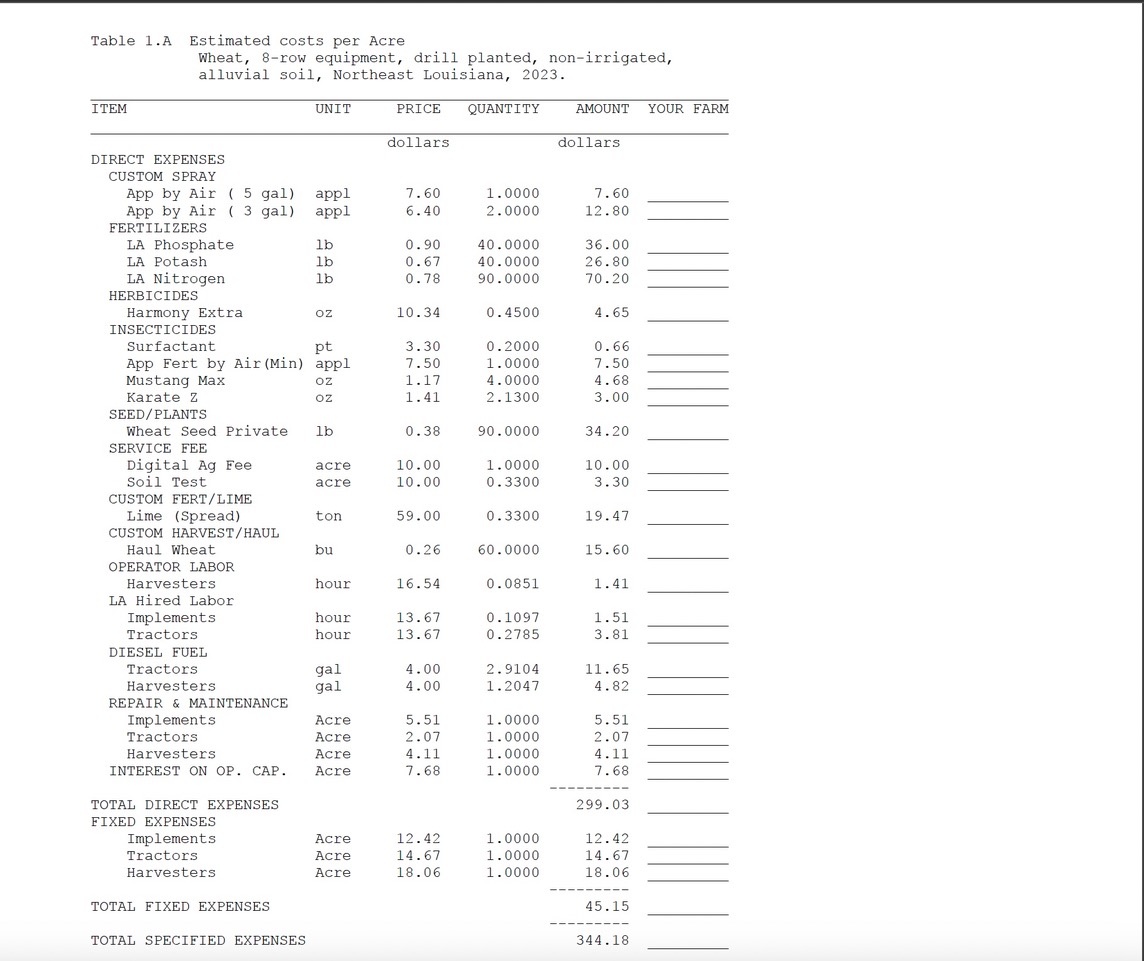
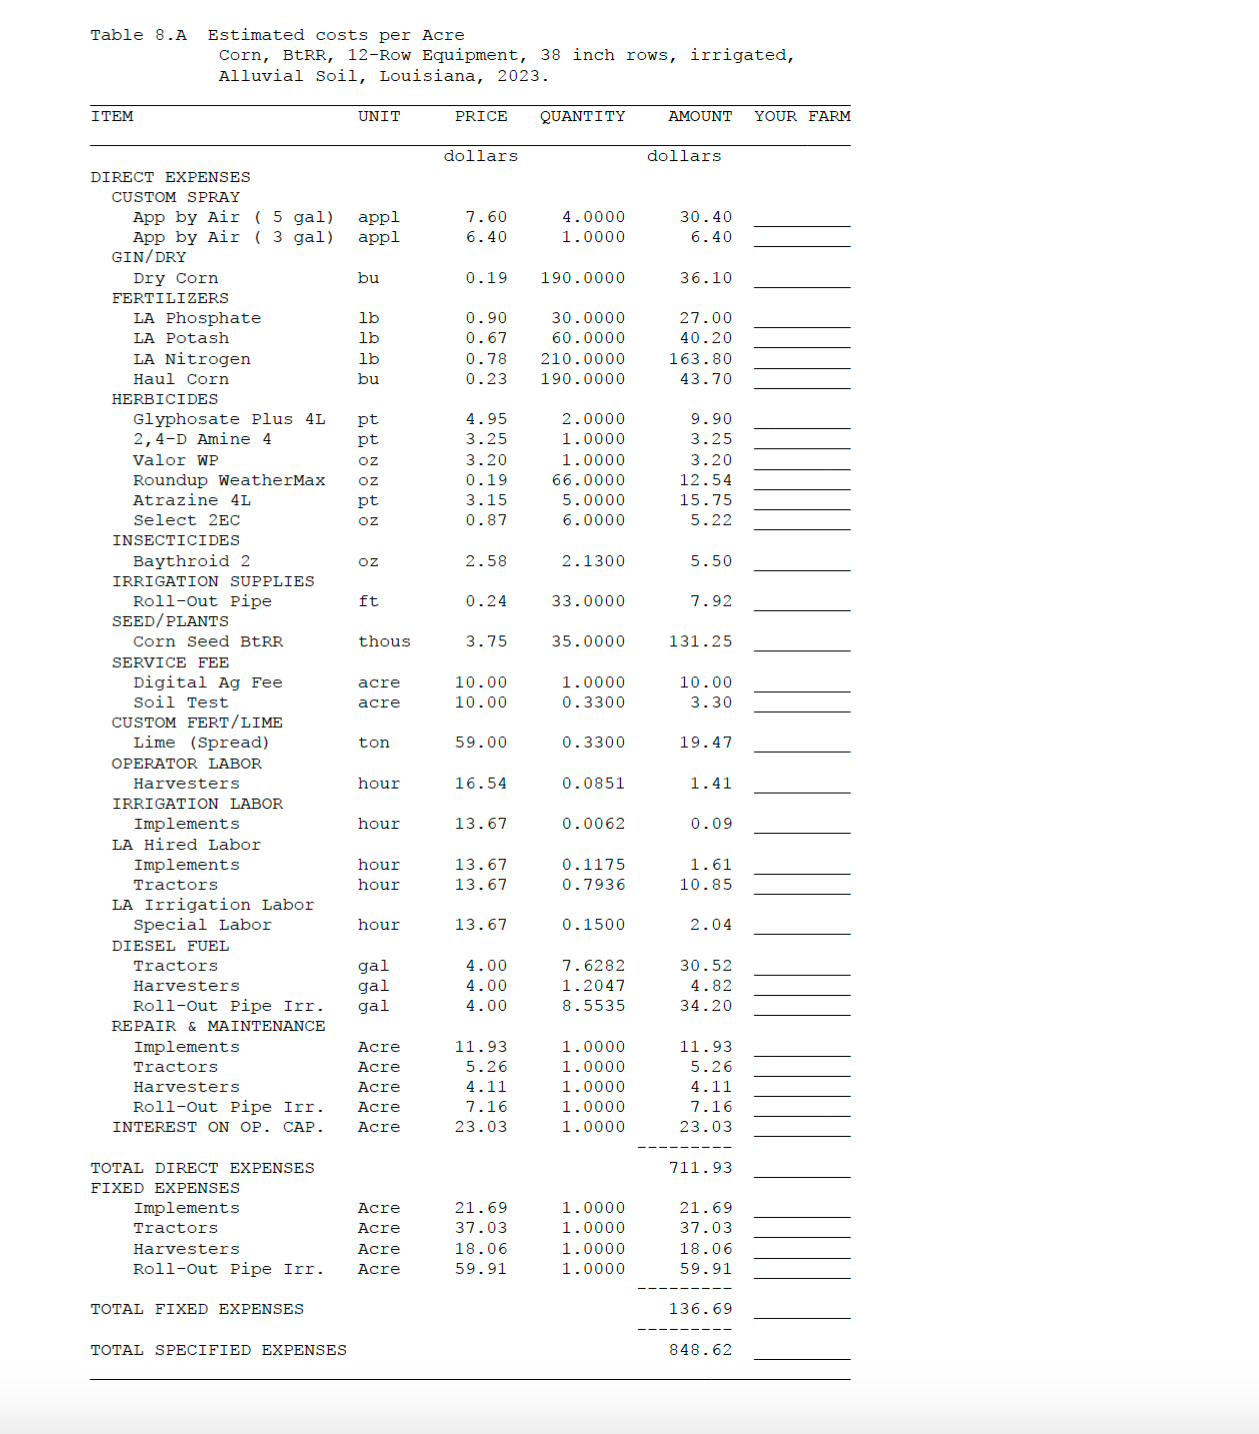
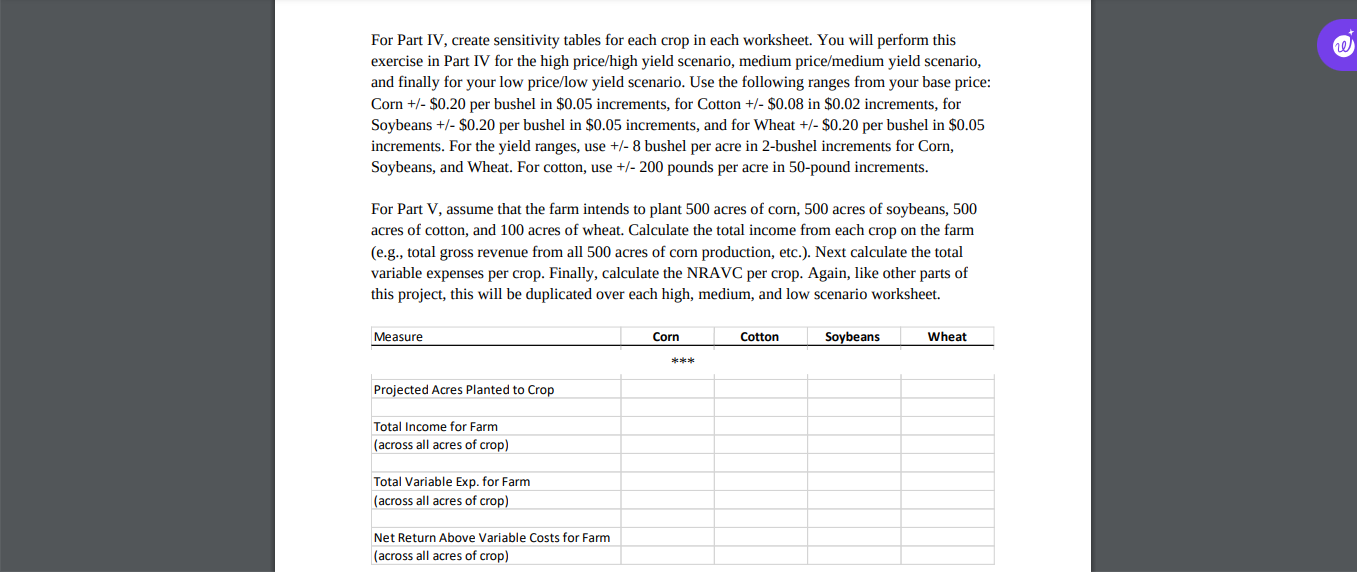
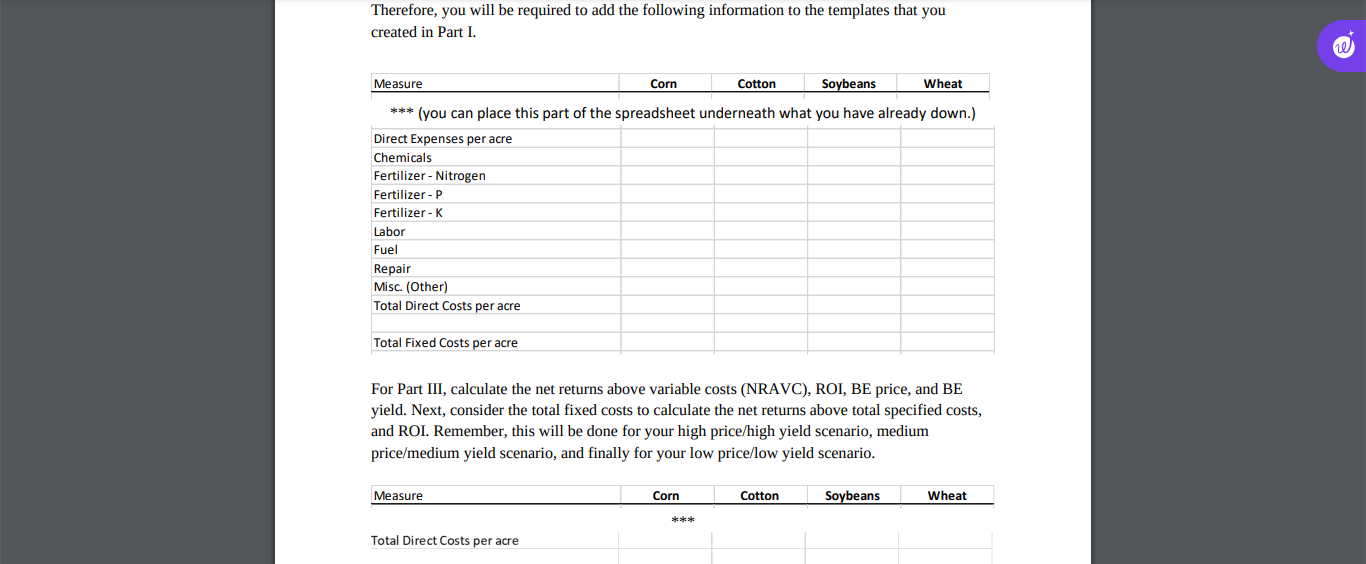
Table 8.A Estimated costs per Acre Corn, BURR, 12-Row Equipment, 38 inch rows, irrigated, Alluvial Soil, Louisiana, 2023. ITEM UNIT PRICE QUANTITY AMOUNT YOUR FARM dollars dollars DIRECT EXPENSES CUSTOM SPRAY App by Air 3 gal) appl 7. 60 4 . 0000 30 . 40 App by Air 3 gal) appl 5. 40 1 . 0000 GIN/DRY Dry Corn bu 0 . 19 190 . 0000 36.10 FERTILIZERS LA Phosphate 1b 0. 90 30. 0000 27.00 LA Potash 1b 0. 67 60 . 0000 40.20 LA Nitrogen 1b 0. 78 210 . 0000 163 . 80 Haul Corn bu 0. 23 190 . 0000 43. 70 HERBICIDES Glyphosate Plus 4L pt 4.95 2. 0000 9. 90 2, 4-D Amine 4 pt 3.25 1 . 0000 3.25 Valor WP oz 3.20 1 . 0000 3.20 Roundup WeatherMax oz 0. 19 6. 0000 12 . 54 Atrazine 4L pt 3. 15 5. 0000 15 .75 Select 2EC oz 0. 87 6. 0000 5. 22 INSECTICIDES Baythroid 2 OZ 2.58 2. 1300 5. 50 IRRIGATION SUPPLIES Roll-Out Pipe ft 0 . 24 33. 0000 7.92 SEED/PLANTS Corn Seed BURR thous 3. 75 35 . 0000 131.25 SERVICE FEE Digital Ag Fee acre 10.00 1 . 0000 10.00 Soil Test acre 10.00 0. 3300 3. 30 CUSTOM FERT Lime (Spread ton 59.00 0 . 3300 19. 47 OPERATOR LABOR Harvesters hour 16 .54 0 . 0851 1 . 41 IRRIGATION LABOR Implements hour 13. 67 0 . 0062 0.09 LA Hired Labor Implements hour 13. 67 0 . 1175 1 . 61 Tractors hour 13. 67 0. 7936 10.85 LA Irrigation Labor Special Labor hour 13. 67 0 . 1500 2. 04 DIESEL FUEL Tractors gal 4.00 7. 6282 30.52 Harvesters gal 1.00 1 . 2047 4. 82 Roll-Out Pipe Irr. gal 4. 00 8 . 5535 34.20 REPAIR & MAINTENANCE Implements Acre 11 . 93 1 . 0000 11 . 93 Tractors Acre 5 .26 1 . 0000 5.26 Harvesters Acre 4. 11 1 . 0000 4. 11 Roll-Out Pipe Irr Acre 7.16 1 . 0000 7. 16 INTEREST ON OP. CAP. Acre 23.03 1 . 0000 23.03 TOTAL DIRECT EXPENSES 711. 93 FIXED EXPENSES Implements Acre 21 . 69 1. 000 21 . 69 Tractors Acre 37 .03 1 . 0000 37.03 Harvesters Acre 18 . 06 1 . 0000 18.06 Roll-Out Pipe Irr. Acre 59 . 91 1 . 0000 59 .91 TOTAL FIXED EXPENSES 136. 69 TOTAL SPECIFIED EXPENSES 848. 62Table 4.A Estimated costs per Acre Cotton, B2/RRFlex Cotton, 12-row equipment, irrigated, Alluvial Soil, Louisiana, 2023. ITEM UNIT PRICE QUANTITY AMOUNT YOUR FARM dollars dollars DIRECT EXPENSES CUSTOM SPRAY App by Air 3 gal) appl 6.4 5.0000 32.0 App by Air ( 5 gal) appl 7.60 1. 0000 7. 60 HARVEST AIDS Dropp SC Oz 1.56 1. 2000 1. 87 Prep pt 3.84 1.3300 5.1 Def/Folex pt 12 .50 0.7500 9. 38 FERTILIZERS LA Phosphate 1b 0.90 60.0000 54.00 LA Potash 1b 0.67 60.000 40 .20 LA Nitrogen 1b 0. 78 90 . 0000 70 .20 HERBICIDES Roundup WeatherMax oz 0.19 38 . 0000 16.72 2, 4-D Amine 4 pt 3.25 1. 0000 3.25 Valor WP oz 3.20 1.5000 4 . 80 Cotoran 41 pt 6.37 1.2000 7. 64 Dual II Magnum pt 11 . 6 1.0000 1. 60 Layby Pro at 3.87 1.0000 3. 87 INSECTICIDES Ammo 2.5 EC oz 0.85 1.2800 1. 09 Dimethoate 4E pt 6.45 0. 4000 2.58 Orthene 90s 1b 7.00 1. 8000 12. 60 Centric 40WG oz 5.95 4.0000 23. 80 Karate Z oz 1.41 6.3900 9. 01 Bidrin 8L oz 1. 43 12.0000 17.16 Diamond . 83EC pt 19.52 0. 7500 14 . 64 IRRIGATION SUPPLIES Roll-out Pipe ft 0.24 33.0000 7. 92 SEED/PLANTS Cotton Seed BGII/RRF thous 2.70 52.5000 141. 75 TECHNOLOGY FEE BGII/RRF Cot Tech Fe cap/ac 52 .69 1. 0000 $2. 69 Eradication Fee acre 6.00 1. 0000 6.00 GROWTH REGULATORS Pix Plus OZ 0. 40 24.0000 9 . 61 SERVICE FEE Crop Consultant acre 9.0 1. 0000 3.00 Digital Ag Fee acre 10.00 1.0000 10.00 Soil Test acre 10.0 0. 3300 3.30 Cotton Checkoff bale 2.56 2.2900 5.86 OPERATOR LABOR self-Propelled hour 16.54 0.2687 1. 77 IRRIGATION LABOR Implements hour 13.67 . 0062 0.09 HAND LABOR Self-Propelled hour 13.67 0. 0352 0.48 LA Hired Labor Implements hour 13.67 0. 1273 1. 73 Tractors hour 3.67 0 . 8276 11 . 32 self-Propelled hour 13.67 0. 2182 2.98 LA Irrigation Labor Special Labor hour 13. 67 0. 1500 2.04 DIESEL FUEL Tractors gal 4.00 3. 0625 32.25 Self-Propelled gal 4.00 6.3428 25.39 Roll-out Pipe Irr. gal 4.00 8.5535 34. 20 REPAIR & MAINTENANCE Implements Acre 10.29 1. 0000 10 .2 Tractors Acre 5.61 1.0000 5. 61 self-Propelled Acre 9.92 1.0000 29.9 Roll-Out Pipe Irr. Acre 7.16 1.0000 7.16 INTEREST ON OP. CAP. Acre 21 . 46 1.0000 21. 46 TOTAL DIRECT EXPENSES 794. 92 FIXED EXPENSES Implements Acre 18.06 1.0000 18.06 Tractors Acre 39.44 1.0090 39.44 Self-Propelled Acre 134.12 1.000 134 . 12 Roll-Out Pipe Irr. Acre 59. 91 1. 0000 59. 91 TOTAL FIXED EXPENSES 251.53 TOTAL SPECIFIED EXPENSES 1046.45Please refer to the \"Enterprise Budget Hwk Project raw data\" spreadsheet posted lo the Chaplet 12 portal on our AGEC 3303 Moodle webpage to access the price and production data [or this assignment. You will also need to use the 'Corn Enterprise Budget, Cotton Enterprise Budget, Soybean Enterprise Budget, and Wheat Enterprise Budget\" PDF documents under the Chapter 12 portal as well. In MS Excel. please complete the following assignment. The price per unit and production (yield per acre) data for corn, soybeans, cotton, and wheat were obtained from USDA NASS. The data is presented for the 2014 to 2023 period. For Part1 of this project, please determine a high, medium, and a lowprice scenario for each crop. Next, delermine a high, medium, and lowiyield scenario {or each crop. What criteria (i.e., metric) did you use to arrive at your values? Please include your calculations that you used. Next create a spreadsheet template that resembles thew following. Measure Carri Carton Soybeans Wheat Estimated Prloe perunlt Estiamted Yleid peracre Gross Revenue peracre You will need to enter your price and yield projections (for each high, medium, and low scenario) so that you can calculate gross revenue per acre. It you prefer, you can create a high worksheet, a medium worksheet, and a low scenario worksheet in your MS Excel file. For Part II, refer to the specific budget tables in each of the LSU AgCenter enterprise budgets to summarize the variable production costs ($ per acre) for chemicals, Nitrogen Fertilizer, Phosphate Fertilizer, Potash (or K) Fertilizer, Labor, Diesel Fuel, Repair, and Miscellaneous (other) expenses. Note that the Misc. category will be all other remaining cost categories relative to the crop's cost structure. . Corn - Table 8A. on page 26. Soybeans - Table 8A. on page 25. . . Cotton - Table 4A. on page 13. Wheat - Table 1A. on page 4. AGEC 3303 Fall 2023 It is acceptable to use the total fixed costs per acre from the LSU AgCenter budgets in your analysis. No additional calculations are required. Therefore, you will be required to add the following information to the templates that you created in Part I.For Part III, calculate the net returns above variable costs (NRAVC), ROI, BE price, and BE yield. Next, consider the total fixed costs to calculate the net returns above total specified costs, and ROI. Remember, this will be done for your high price/high yield scenario, medium price/medium yield scenario, and finally for your low price/low yield scenario. Measure Corn Cotton Soybeans Wheat Total Direct Costs per acre Total Fixed Costs per acre Net Returns Above Variable Costs per acre Breakeven Analysis - BE Price Breakeven Analysis - BE Yield ROI (Variable Cost Only) Net Returns Above Total Costs per acre 2For Part IV, create sensitivity tables for each crop in each worksheet. You will perform this exercise in Part IV for the high price/high yield scenario, medium price/medium yield scenario, and finally for your low price/low yield scenario. Use the following ranges from your base price: Corn +/- $0.20 per bushel in $0.05 increments, for Cotton +/- $0.08 in $0.02 increments, for Soybeans +/- $0.20 per bushel in $0.05 increments, and for Wheat +/- $0.20 per bushel in $0.05 increments. For the yield ranges, use +/- 8 bushel per acre in 2-bushel increments for Corn, Soybeans, and Wheat. For cotton, use +/- 200 pounds per acre in 50-pound increments. For Part V, assume that the farm intends to plant 500 acres of corn, 500 acres of soybeans, 500 acres of cotton, and 100 acres of wheat. Calculate the total income from each crop on the farm (e.g., total gross revenue from all 500 acres of corn production, etc.). Next calculate the total variable expenses per crop. Finally, calculate the NRAVC per crop. Again, like other parts of this project, this will be duplicated over each high, medium, and low scenario worksheet. Measure Corn Cotton Soybeans Wheat Projected Acres Planted to Crop Total Income for Farm (across all acres of crop) Total Variable Exp. for Farm (across all acres of crop) Net Return Above Variable Costs for Farm (across all acres of crop)X Enterprise Budget Hwk Project in November raw data (3).xIsx File Edit Insert Format Help Calibri 11 BIUSA. S fx A B C D E F G H I J K L M N O P Q R Farm Management Hwk Project Data Price Received per unit Yields per acre Obs. No. Year Corn Cotton Lint Soybeans Wheat Obs. No. Year Corn Cotton Lint Soybeans Wheat (bu) ( lb.) (bu) (bu) bu) (lb.) (bu) (bu) 2014 $4.15 $0.626 $10.90 $5.62 2014 197.5 1,156 64.2 62.5 2015 $4.00 $0.678 $9.74 $5.17 WN E 2015 187.7 762 49.1 52.4 8 2016 $3.70 $0.698 $9.93 $4.66 2016 181.5 1,029 57.9 59.6 2017 $3.72 $0.715 $9.67 $4.46 4 2017 184.5 961 59 49.6 10 2018 $3.86 $0.755 $8.95 $4.88 5 2018 186.2 1,121 61.7 55.2 11 2019 $3.86 $0.641 $8.70 $5.12 6 2019 170.1 1,058 54.6 52 12 2020 $3.74 $0.669 $10.00 $5.44 2020 190.6 1,093 50.3 55 13 2021 $5.29 $0.882 $12.40 $6.44 8 2021 196.3 1,035 56.1 54 14 2022 $6.65 $0.925 $13.50 $7.63 2022 172.7 905 54.7 48 15 10 2023 $4.90 $0.800 $12.90 $7.00 10 2023 170 995 50 45 16 17 18 19 20Therefore, you will be required to add the following information to the templates that you created in Part I. Measure Corn Cotton Soybeans Wheat ***(you can place this part of the spreadsheet underneath what you have already down.) Direct Expenses per acre Chemicals Fertilizer - Nitrogen Fertilizer - P Fertilizer - K Labor Fuel Repair Misc. (Other) Total Direct Costs per acre Total Fixed Costs per acre For Part III, calculate the net returns above variable costs (NRAVC), ROI, BE price, and BE yield. Next, consider the total fixed costs to calculate the net returns above total specified costs, and ROI. Remember, this will be done for your high price/high yield scenario, medium price/medium yield scenario, and finally for your low price/low yield scenario. Measure Corn Cotton Soybeans Wheat * * * Total Direct Costs per acreTable 8.A Estimated costs per Acre Soybeans, RR, 12-row equipment, stale seedbed, irrigated, alluvial soils, Northeast Louisiana, 2023. ITEM UNIT PRICE QUANTITY AMOUNT YOUR FARM dollars dollars DIRECT EXPENSES CUSTOM SPRAY App by Air 5 gal) app] 7. 60 2.0000 15.2 App by Air 3 gall appl 6.40 6.0000 38 . 40 HARVEST AIDS Gramoxone Inteon OZ 0 . 19 16.0000 3.04 FERTILIZERS LA Phosphate 1b 0.90 50.0000 45.00 LA Potash 1b 0. 67 50.0000 33.50 FUNGICIDES Quadris Oz 6.73 6. 0000 40 .38 Stratego pt 23.93 0 . 6250 14.96 HERBICIDES Roundup WeatherMax OZ 0.19 66.0000 12 . 54 2, 4-D Amine 4 pt 3.25 1.0000 3.25 Valor WP oz 3. 20 2.0000 6.40 Dual II Magnum pt 11 . 60 1.0000 1 . 60 Flexstar HL pt 6.88 1. 0000 . 88 INSECTICIDES Brigade EC pt 9 . 60 0. 7500 7.20 Prevathon oz 1. 05 16.0000 16.80 Besiege oz 2. 75 10.0000 27.50 Surfactant pt 3. 30 1. 0000 3.30 IRRIGATION SUPPLIES Roll-Out Pipe ft 0 . 24 33. 0000 7.92 SEED/PLANTS Soybean Seed RR 1b 1. 16 50.0000 58 .00 SERVICE FEE Digital Ag Fee acr 10.00 1 . 0000 10.00 Soil Test acre 10.00 0. 3300 3,30 CUSTOM FERT/LIME Lime (Spread) ton 59.00 0.3300 19. 47 CUSTOM HARVEST/HAUL Haul Soybeans 0.27 55.0000 14. 85 OPERATOR LABOR Harvesters hour 16.54 0. 0851 1. 41 IRRIGATION LABOR Implements hour 13 .67 0. 0062 0 . 09 LA Hired Labor Implements hour 13 . 67 0.0966 1 . 32 Tractors hour 13.67 0. 6447 3. 81 LA Irrigation Labor Special Labor hour 13. 67 0. 1500 2.04 DIESEL FUEL Tractors gal 4.00 6. 4077 25.63 Harvesters gal 4.00 1. 2047 4. 82 Roll-Out Pipe Irr. gal 4.00 4. 8877 19.56 REPAIR & MAINTENANCE Implements Acre 6.98 1.0000 6.98 Tractors Acr 4 . 48 1.0000 . 48 Harvesters Acre 1 . 11 1.0000 4. 11 Roll-Out Pipe Irr. Acre 5.36 1.0000 . 36 INTEREST ON OP. CAP. Acre 11 . 06 1.0000 11. 06 TOTAL DIRECT EXPENSES 495. 16 FIXED EXPENSES Implements Acre 15 .12 1.0000 15.12 Tractors Acre 31.57 1.0000 31.57 Harvesters Acre 18.06 1.0000 18.06 Roll-Out Pipe Irr. Acre 59 . 91 1.0000 59 .91 TOTAL FIXED EXPENSES 124. 66 TOTAL SPECIFIED EXPENSES 619. 82Table 1.A Estimated costs per Acre Wheat, S-row equipment, drill planted, non-irrigated, alluvial soil, Northeast Louisiana, 2023. ITEM UNIT PRICE QUANTITY AMOUNT YOUR FARM dollars dollars DIRECT EXPENSES CUSTOM SPRAY App by Air { 5 gal) appl 7.60 1.0000 7.60 App by Air ( 3 gal} appl 6.40 2.0000 12.80 FERTILIZERS LA PhOSphate lb 0.90 40.0000 36.00 LA Potash 1b 0.67 40.0000 26.80 LA Nitrogen lb 0.70 90.0000 70.20 HERBICIDES Harmony Extra oz 10.34 0.4500 4.65 INSECTICIDES Surfactant pt 3.30 0.2000 0.66 App Fert by AirtMin) appl 7.50 1.0000 7.50 Mustang Max 02 1.17 4.0000 4.68 Karate Z 02 1.41 2.1300 3.00 SEEDIPLANTS Wheat Seed Private lb 0.33 90.0000 34.20 SERVICE FEE Digital Ag Fee acre 10.00 1.0000 10.00 Soil Test acre 10.00 0.3300 3.30 CUSTOM FEET/LIME Lime {Spread} ton 59.00 0.3300 19.47 CUSTOM HARVEST/HAUL Haul Wheat bu 0.26 60.0000 15.60 OPERATOR LABOR Harvesters hour 16.54 0.0351 1.41 LA Hired Labor Implements hour 13.67 0.1097 1.51 Tractors hour 13.67 0.2705 3.81 DIESEL FUEL Tractors gal 4.00 2.9104 11.65 Harvesters gal 4.00 1.2047 4.82 REPAIR & MAINTENANCE Implements Acre 5.51 1.0000 5.51 Tractors Acre 2.07 1.0000 2.07 Harvesters Acre 4.11 1.0000 4.11 INTEREST 0N OP. CAP. Acre 7.60 1.0000 7.68 TOTAL DIRECT EXPENSES 299.03 FIXED EXPENSES Implements Acre 12.42 1.0000 12.42 Tractors Acre 14.67 1.0000 14.67 Harvesters Acre 18.06 1.0000 18.06 TOTAL FIXED EXPENSES 45.15 TOTAL SPECIFIED EXPENSES 344.13
Step by Step Solution
There are 3 Steps involved in it

Get step-by-step solutions from verified subject matter experts