

Question: Please help me solve this. I have attached the problem along with my excel sheet to start if needed. fProblems Problem 12-4 Problem 12-11 Problem
Please help me solve this. I have attached the problem along with my excel sheet to start if needed.
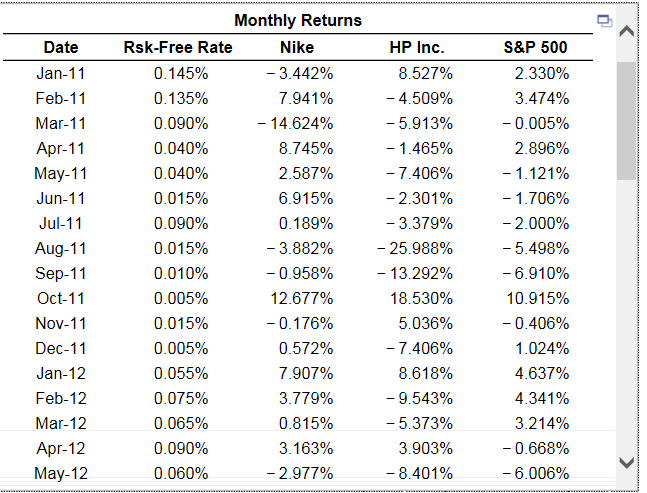
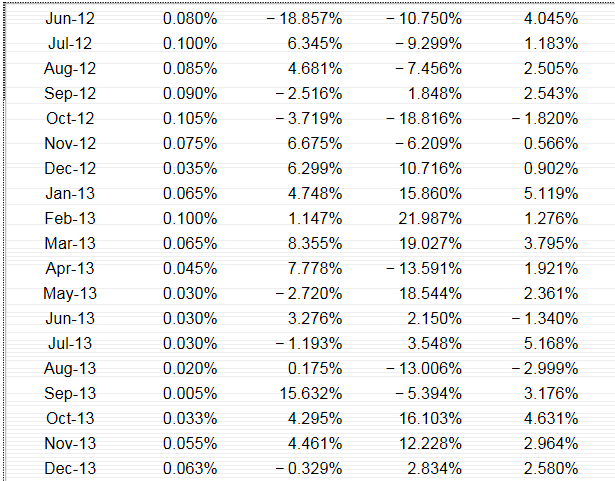
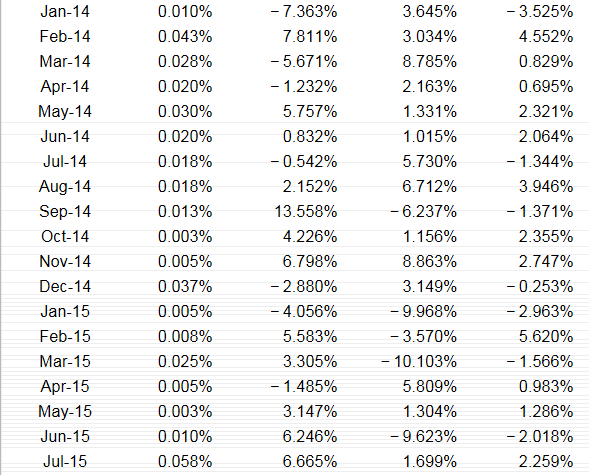


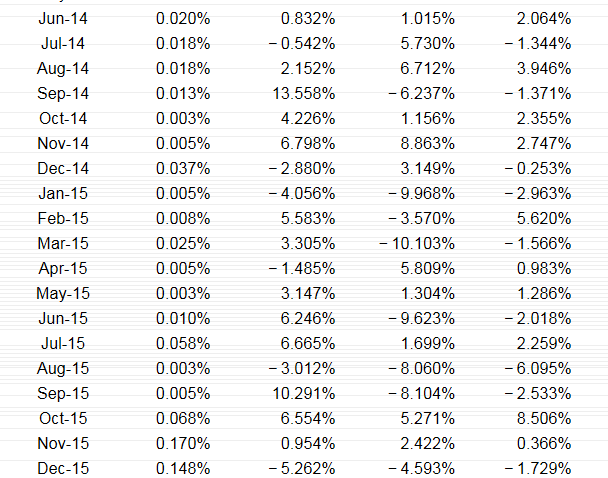
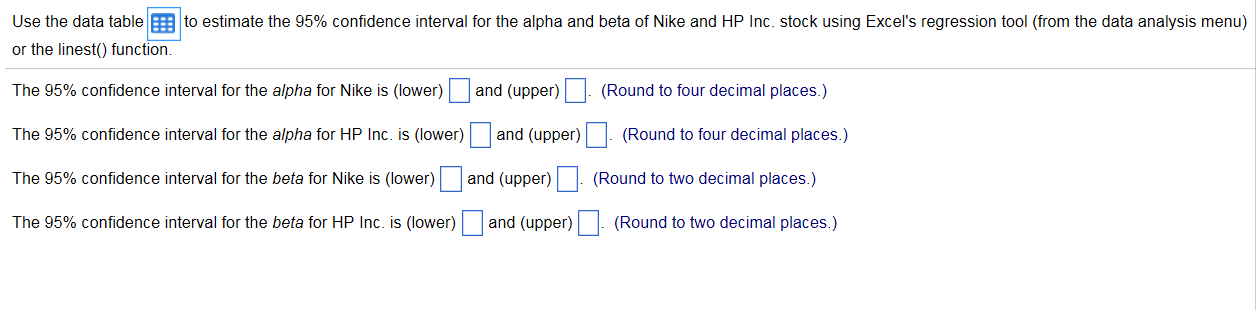
\fProblems Problem 12-4 Problem 12-11 Problem 12-12 Problem 12-13 Problem 12-4 Suppose all possible investment opportunities in the world are limited to the five stocks listed in the table below. What does the market portfolio consist of? Stock A B C D E Stock A B C D E Price/Share ($) 10 20 8 50 45 Number of Shares Outstanding (millions) 10 12 3 1 20 Value of the market portfolio: 1,314.00 Price/Share ($) 10.00 20.00 8.00 50.00 45.00 Number of Shares Outstanding Percent of (millions) Market value ($) Market portfolio 10 100 7.61% 12 240 18.26% 3 24 1.83% 1 50 3.81% 20 900 68.49% 1,314 Problem 12-11 Go to Chapter Resources on MyFinanceLab and use the data in the spreadsheet provided to estimate the beta of Nike and Dell stock based on their monthly returns from 2007-2011. (Hint: You can use the slope() function in Excel.) Nike Dell #VALUE! #VALUE! Problem 12-12 Using the same data as in Problem 11, estimate the alpha of Nike and Dell stock, expressed as a % per month. (Hint: You can use the intercept() function in Excel.) Nike Dell #VALUE! #VALUE! Problem 12-13 Using the same data as in Problem 11, estimate the 95% confidence interval for the alpha and beta of Nike and Dell stock using Excel's regression tool (from the data analysis menu). Nike Stock: SUMMARY OUTPUT Regression Statistics Multiple R 0.6689388472 R Square 0.4474791813 Adjusted R Square 0.4379529602 Standard Error 0.055056126 Observations 60 ANOVA df SS MS F Significance F Regression 1 0.1423847512 0.1423847512 46.9734200636 5.15877029999E-009 Residual 58 0.1758082668 0.003031177 Total 59 0.318193018 Coefficients Standard Error t Stat P-value Lower 95% Upper 95%Lower 95. Upper 95.0% Intercept 0.0138442622 0.0071077811 1.9477614828 0.0562890631 -0.0003835074 0.028072 -0.000384 0.028072 X Variable 1 0.8990960985 0.1311837442 6.8537157851 5.15877029999E-009 0.6365033041 1.161689 0.636503 1.161689 Dell Stock: SUMMARY OUTPUT Regression Statistics Multiple R 0.6816579427 R Square 0.4646575509 Adjusted R Square 0.4554275087 Standard Error 0.0805180064 Observations 60 ANOVA Regression Residual Total df 1 58 59 SS 0.3263738376 0.3760226628 0.7023965004 MS 0.3263738376 0.0064831494 F 50.3418662152 Intercept X Variable 1 Coefficients -0.0040953821 1.3612316611 Standard Error 0.0103949261 0.1918524662 t Stat -0.3939789521 7.0952002238 P-value 0.6950413623 0.000000002 Significance F 0.000000002 Lower 95% Upper 95%Lower 95.0% Upper 95.0% -0.0249030874 0.016712 -0.024903 0.016712 0.9771972252 1.745266 0.977197 1.745266 Date Jan-11 Feb-11 Mar-11 Apr-11 May-11 Jun-11 Jul-11 Aug-11 Sep-11 Oct-11 Nov-11 Dec-11 Jan-12 Feb-12 Mar-12 Apr-12 May-12 Jun-12 Jul-12 Aug-12 Sep-12 Oct-12 Nov-12 Dec-12 Jan-13 Feb-13 Mar-13 Apr-13 May-13 Jun-13 Jul-13 Aug-13 Sep-13 Oct-13 Nov-13 Dec-13 Jan-14 Feb-14 Mar-14 Apr-14 May-14 Jun-14 Jul-14 Aug-14 Sep-14 Oct-14 Nov-14 Dec-14 Jan-15 Feb-15 Mar-15 Apr-15 Rate 0.00145 0.00135 0.0009 0.0004 0.0004 0.00015 0.0009 0.00015 0.0001 0.00005 0.00015 0.00005 0.00055 0.00075 0.00065 0.0009 0.0006 0.0008 0.001 0.00085 0.0009 0.00105 0.00075 0.00035 0.00065 0.001 0.00065 0.00045 0.0003 0.0003 0.0003 0.0002 0.00005 0.00033 0.00055 0.00063 0.0001 0.00043 0.00028 0.0002 0.0003 0.0002 0.00018 0.00018 0.00013 0.00003 0.00005 0.00037 0.00005 0.00008 0.00025 0.00005 NIKE -0.03442 0.07941 -0.14624 0.08745 0.02587 0.06915 0.00189 -0.03882 -0.00958 0.12677 -0.00176 0.0572 0.07907 0.03779 0.00815 0.03163 -0.02977 -0.18857 0.06345 0.04681 -0.02516 -0.03719 0.06675 0.06299 0.04748 0.01147 0.08355 0.07778 -0.0272 0.03276 -0.01193 0.00175 0.15632 0.04295 0.04461 -0.00329 -0.07363 0.07811 -0.05671 -0.01232 -0.01232 0.0832 -0.00542 0.02152 0.13558 0.04226 0.06798 -0.0288 -0.04056 0.05583 0.03305 -0.01485 HP Inc S&P 500 0.085270 0.0233 -0.045090 0.03474 -0.059130 -0.00005 -0.014650 0.02896 -0.074060 -0.01121 -0.023010 -0.01706 -0.033790 -0.02 -0.259880 -0.05498 -0.132920 -0.0691 0.185300 0.10915 0.050360 -0.00406 -0.074060 0.01024 0.086180 0.04637 -0.095430 0.04341 -0.053730 0.03214 0.039030 -0.00668 -0.084010 -0.06006 -0.107500 0.04045 -0.092990 0.01183 -0.074560 0.02505 0.018480 0.02543 -0.188160 -0.0182 -0.062090 0.00566 0.107160 0.00902 0.158600 0.05119 0.219870 0.01276 0.190270 0.03795 -0.135910 0.01921 0.185440 0.02361 0.021500 -0.0134 0.035480 0.05168 -0.130060 -0.02999 -0.053940 0.03176 0.161030 0.04631 0.122280 0.02964 0.028340 0.0258 0.036450 -0.03525 0.030340 0.04552 0.087850 0.00829 0.021630 0.00695 0.021630 -0.079851 0.010150 0.02064 0.054300 -0.01344 0.067120 0.03946 -0.062370 -0.01371 0.011560 0.02355 0.055630 0.02747 0.031490 -0.00253 -0.099680 -0.02963 -0.035700 0.0562 -0.101030 -0.01566 0.058090 0.00983 May-15 Jun-15 Jul-15 Aug-15 Sep-15 Oct-15 Nov-15 Dec-15 0.00003 0.0001 0.00058 0.00003 0.00005 0.00068 0.0017 0.00148 0.03147 0.06246 0.06665 -0.03012 0.10291 0.06554 0.0954 -0.05262 0.013040 -0.096230 0.016990 -0.080600 -0.081040 0.052710 0.024220 -0.045930 0.01286 -0.02018 0.02259 -0.06095 -0.02533 0.08506 0.00366 -0.01729
Step by Step Solution
There are 3 Steps involved in it

Get step-by-step solutions from verified subject matter experts