

Question: PLEASE HELP ME SOLVE THIS, I WILL GIVE YOU THUMB THEN. NEED URGENT PLEASE! TQ SO MUCH Prepare a financial statement analysis report containing: a)
PLEASE HELP ME SOLVE THIS, I WILL GIVE YOU THUMB THEN. NEED URGENT PLEASE! TQ SO MUCH
Prepare a financial statement analysis report containing:
a) Quantitative analysis i . analysis of financial performance information [refer to the report below]
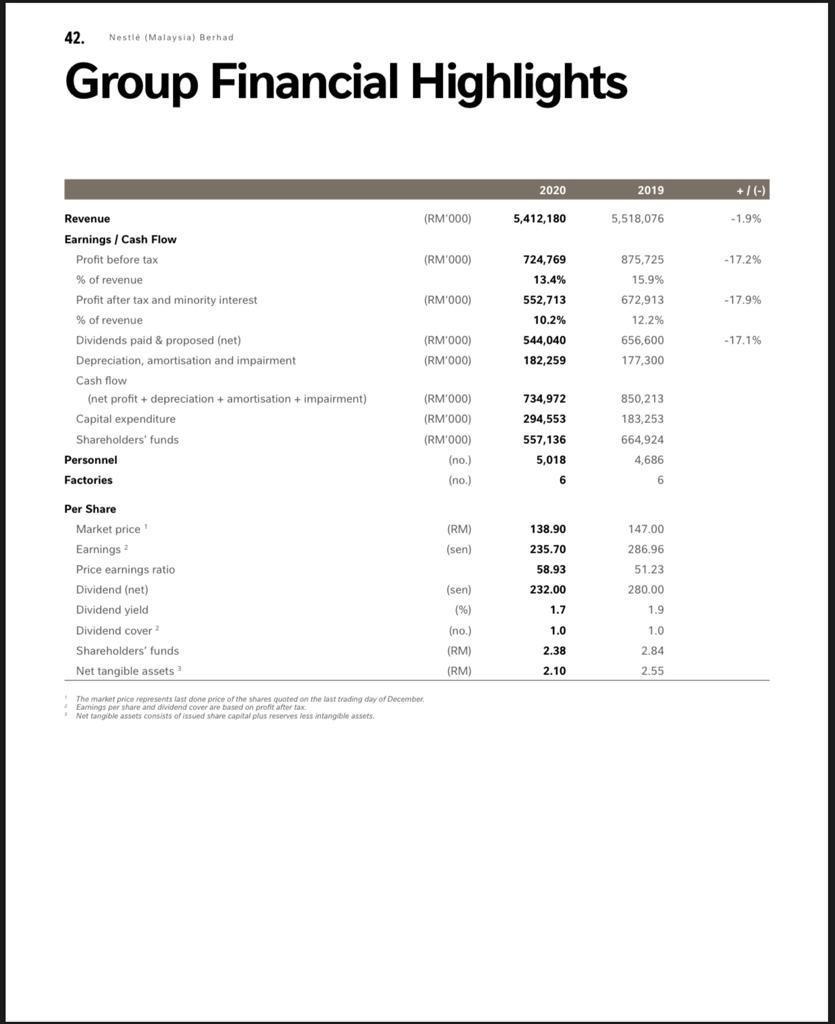
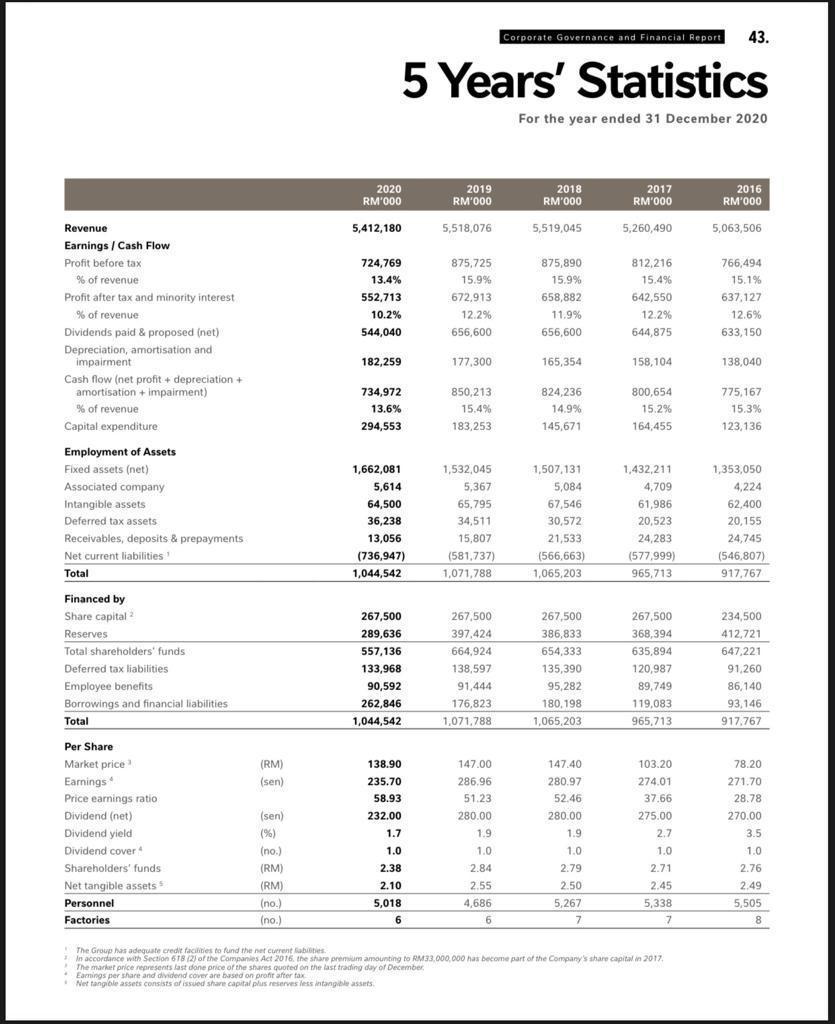
42. Nestle (Malaysia) Berhad Group Financial Highlights 2020 2019 +/ +/(-) (RM'000) 5,412,180 5,518,076 -1.9% (RM'000) - 17.2% (RM'000) - 17.9% Revenue Earnings / Cash Flow Profit before tax % of revenue Profit after tax and minority interest % of revenue Dividends paid & proposed (net) Depreciation, amortisation and impairment Cash flow (net profit + depreciation + amortisation + impairment) ) Capital expenditure Shareholders' funds Personnel Factories 724,769 13.4% 552,713 10.2% 544,040 182,259 875,725 15.9% 672,913 12.2% 656,600 177,300 - 17.1% (RM'000) (RM/000) (RM'000) (RM'000) (RM'000) (no.) . (no.) 734,972 294,553 557,136 5,018 850,213 183,253 664,924 4,686 6 6 (RM) (sen) Per Share Market price Earnings Price earnings ratio Dividend (net) ) Dividend yield Dividend cover Shareholders' funds Net tangible assets 138.90 235.70 58.93 232.00 147.00 286.96 51.23 280.00 1.9 1.7 (sen) (%) ( (no.) (RM) ) (RM) 1.0 2.38 2.10 1.0 2.84 2.55 The market price represents last done price of the shares quoted on the last trading day of December Eamings por share and dividend cover are based on profit after tak Netfangible assets consists of issued share capital plus resenes less intangible assets. Corporate Governance and Financial Report 43. 5 Years' Statistics For the year ended 31 December 2020 2020 RM'000 2019 RM'000 2018 RM'000 2017 RM'000 2016 RM'000 5,412,180 5,518,076 5,519,045 5,260,490 5,063,506 875,725 15.9% Revenue Earnings / Cash Flow Profit before tax % of revenue Profit after tax and minority interest % of revenue Dividends paid & proposed (net) Depreciation, amortisation and impairment Cash flow (net profit + depreciation + amortisation + impairment) % of revenue Capital expenditure 724,769 13.4% 552,713 10.2% 544,040 672.913 875,890 15.9% 658,882 11.9% % 656,600 812,216 15.496 642,550 12.2% 644,875 766,494 15.1% 637,127 12.6% 633,150 12.2% 656,600 182,259 177,300 165,354 158,104 138,040 734,972 13.6% 294,553 850,213 15.4% 183,253 824,236 14.9% 145,671 800,654 15.2% 164,455 775,167 15.3% 123,136 Employment of Assets Fixed assets (net) Associated company Intangible assets Deferred tax assets Receivables, deposits & prepayments , Net current liabilities Total 1,662,081 5,614 64,500 36,238 13,056 (736,947) 1,044,542 1,532,045 5,367 65,795 34,511 15,807 (581,737) 1,071,788 1,507,131 5,084 67,546 30,572 21,533 ( (566,663) 1,065,203 1,432,211 4,709 61,986 20,523 1,353,050 4,224 62,400 20,155 24,745 (546,807) 917,767 24,283 (577,999) 965,713 Financed by Share capital Reserves Total shareholders' funds ' Deferred tax liabilities Employee benefits Borrowings and financial liabilities Total 267,500 289,636 557,136 133,968 90,592 262,846 1,044,542 267,500 397,424 664,924 138,597 91.444 267,500 386,833 654,333 135,390 95,282 180.198 1,065,203 267,500 368,394 635,894 120,987 89,749 119,083 965,713 234,500 412,721 647,221 91,260 86,140 93,146 917.767 176,823 1,071,788 103.20 (RM) (sen) Per Share Market price Earnings Price earnings ratio Dividend (net) Dividend yield Dividend cover Shareholders' funds Net tangible assets Personnel Factories (sen) (%) (no.) ( (RM) (RM) (no.) (no.) 138.90 235.70 58.93 232.00 1.7 1.0 2.38 2.10 5,018 6 147.00 286.96 51.23 280.00 1.9 1.0 2.84 2.55 4,686 6 147.40 280.97 52.46 280.00 1.9 1.0 2.79 2.50 5,267 274.01 37.66 275.00 2.7 1.0 2.71 2.45 5,338 7 78.20 271.70 28.78 270.00 3.5 1.0 2.76 2.49 5,505 7 8 The Group has adequate credit facilities to fund the net currenties In accordance with Section 618/2) of the Companies Act 2016. the share premium amounting to RM33.000.000 has become part of the Company's share capital in 2017. The market price represents last one price of the shares quoted on the last trading day of December Earnings per share and dividend cover are based on profit after fax Nettangible assets consists of issued Share capital plus reserves less intangible assets
Step by Step Solution
There are 3 Steps involved in it

Get step-by-step solutions from verified subject matter experts