

Question: Please help me solve this Math-156 question You are applying for a job in the health care field. As part of the interview process, the
Please help me solve this Math-156 question
You are applying for a job in the health care field. As part of the interview process, the hiring committee
would like to explore your ability to analyze data and discuss the results of your research. The committee gives
you the following assignment:
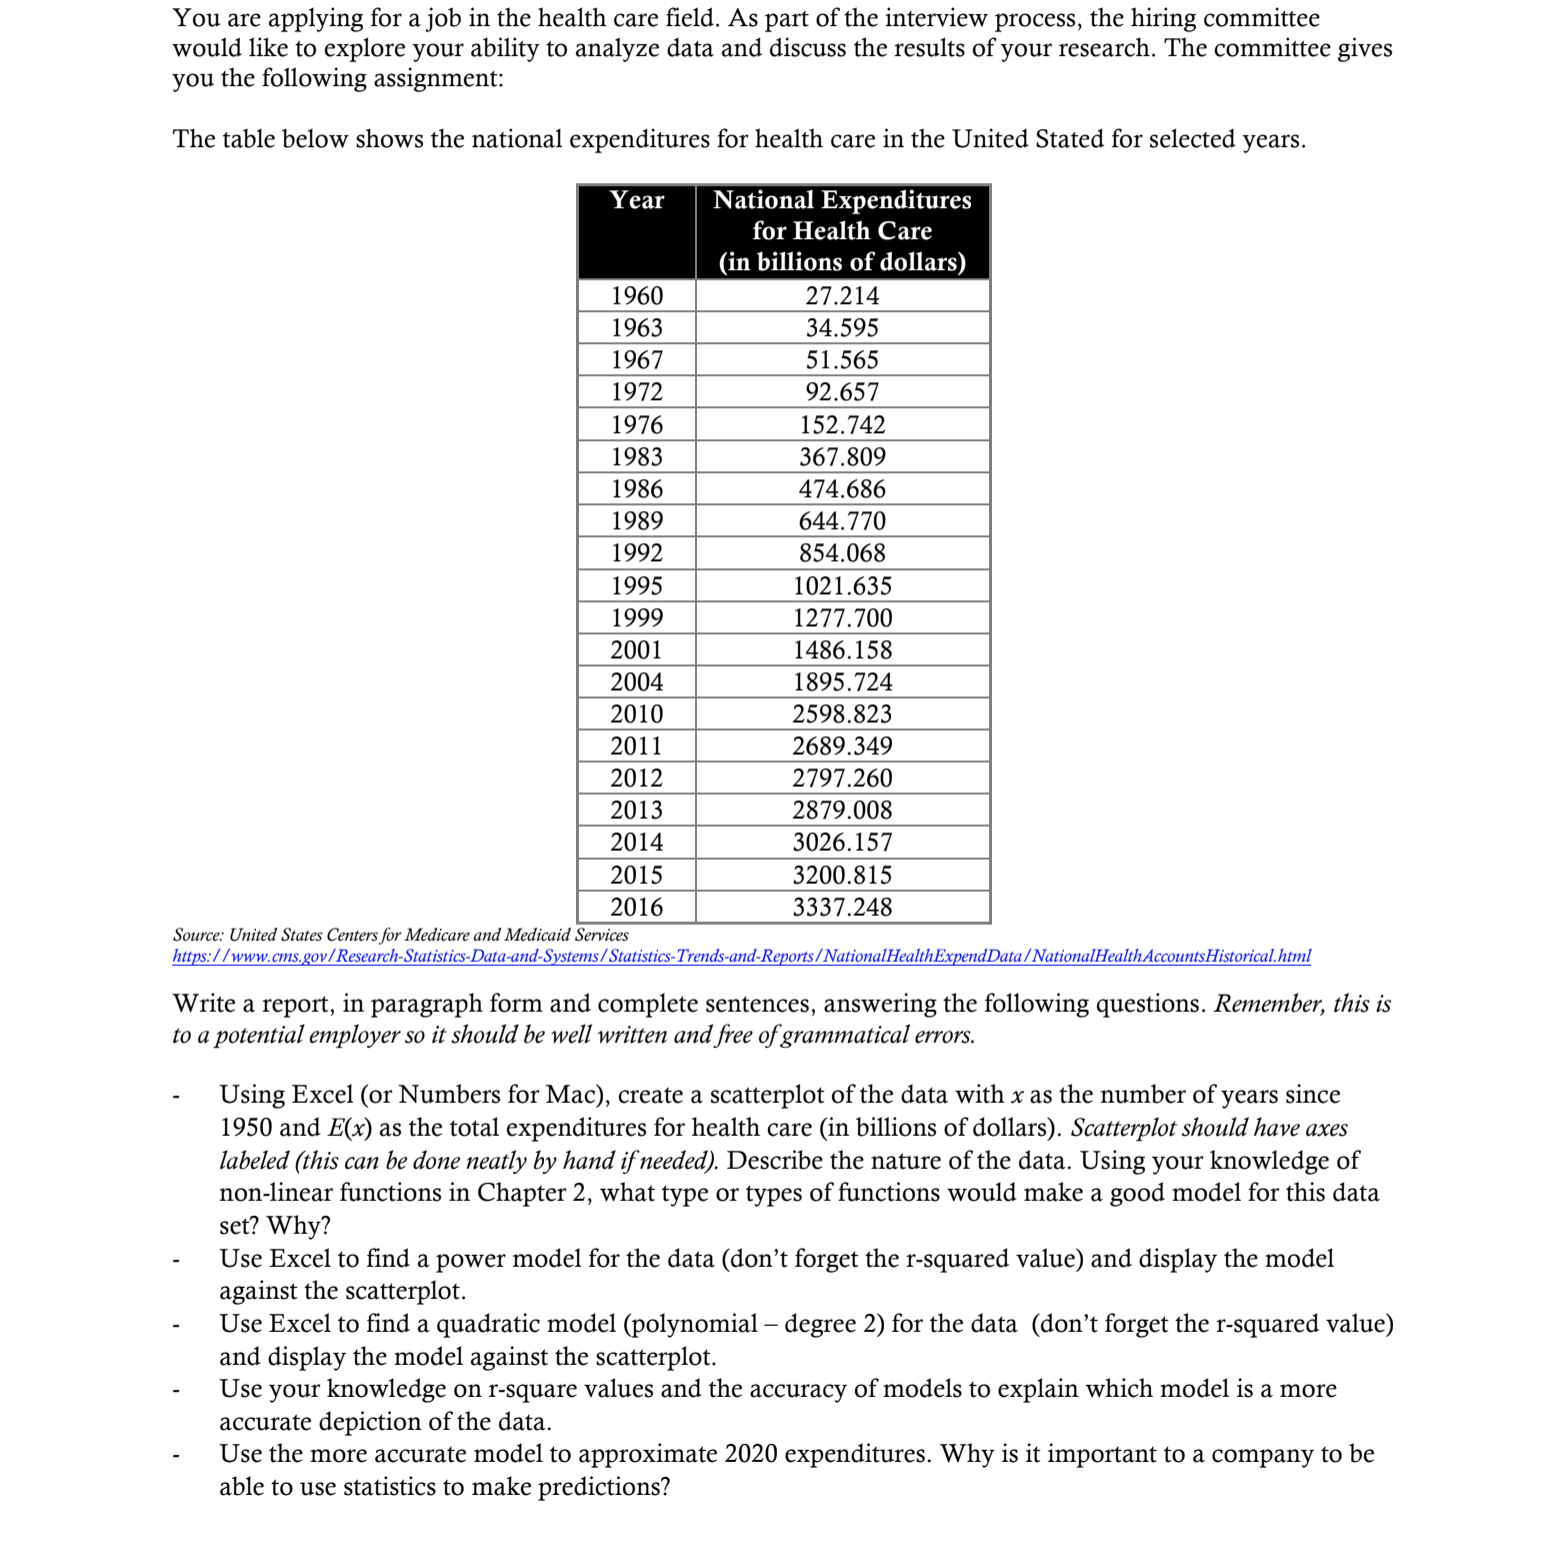
The table below shows the national expenditures for health care in the United States for selected years.
Year National Expenditures for Health Care (in billions of dollars)
1960 27.214
1963 34.595
1967 51.565
1972 92.657
1976 152.742
1983 367.809
1986 474.686
1989 644.770
1992 854.068
1995 1021.635
1999 1277.700
2001 1486.158
2004 1895.724
2010 2598.823
2011 2689.349
2012 2797.260
2013 2879.008
2014 3026.157
2015 3200.815
2016 3337.248
Source: United States Centers for Medicare and Medicaid Services
https://www.cms.gov/Research-Statistics-Data-and-Systems/Statistics-Trends-and-Reports/NationalHealthExpendData/NationalHealthAccountsHistorical.html
in paragraph form and complete sentences, answering the following questions. Remember, this is
to a potential employer so it should be well written and free of grammatical errors.
- Using Excel (or Numbers for Mac), show a scatterplot of the data with x as the number of years since
1950 and E(x) as the total expenditures for health care (in billions of dollars). Scatterplot should have axes
labeled (this can be done neatly by hand if needed). Describe the nature of the data. what type or types of functions would make a good model for this data
set?
- Use Excel to find a power model for the data (don't forget the r-squared value) and display the model
against the scatterplot.
- Use Excel to find a quadratic model (polynomial - degree 2) for the data (don't forget the r-squared value)
and display the model against the scatterplot.
- which model is a more accurate depiction of the data.
- approximate 2020 expenditures.
 You are applying for a job in the health care eld. As part of the interview process, the hiring committee would like to explore your ability to analyze data and discuss the results of your research. The committee gives you the following assignment: The table below shows the national expenditures for health care in the United Stated for selected years. Source: United States Centersir Medicare and Medimt'd Service: h Year National Expenditures for Health Care (in billions of dollars) W 27214 IKE- 34.595 1967 mm- 1972 92.657 1976 152.742 1983 367.809 1986 474.686 1989 644.770 1992 854.068 m 1021.635 IE- 1277.700 2001 1486.158 1895.724 2010 2598.823 2011 2689.349 2012 2797.260 2013 2879.008 2014 3026.157 2015 3200.815 2016 3337.248 .'waw.cms. ov/Researrh-StatisticsDam-andS stems/Statisries-Trmds-and-Rc arts/Nationalel.' dDataI'NationalHeahhAcmunterstort'ml.hm! Write a report, in paragraph form and complete sentences, answering the following questions. Remember, this is to a potential employer so it should be well written and free of grammatical errors. Using Excel (or Numbers for Mac), create a scattetplot of the data with x as the number of years since 1950 and E(x) as the total expenditures for health care (in billions of dollars). Scatterplot should have axes labeled (this can he done neatly by hand if needed). Describe the nature of the data. Using your knowledge of non-linear functions in Chapter 2, what type or types of functions would make a good model for this data set? Why? Use Excel to nd a power model for the data (don't forget the rsquared value) and display the model against the scatterplot. Use Excel to nd a quadratic model (polynomial degree 2) for the data (don't forget the rsquared value) and display the model against the scatterplot. Use your knowledge on r-square values and the accuracy of models to explain which model is a more accurate depiction of the data. Use the more accurate model to approximate 2020 expenditures. Why is it important to a company to be able to use statistics to make predictions
Step by Step Solution
There are 3 Steps involved in it

Get step-by-step solutions from verified subject matter experts