

Question: please help me solve this problem and if you would include the excel formaulas that would be great + Mg Cong 1. || Co Sant
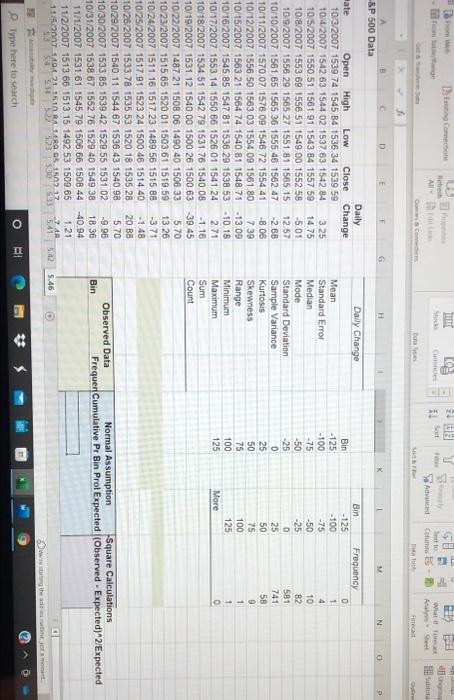
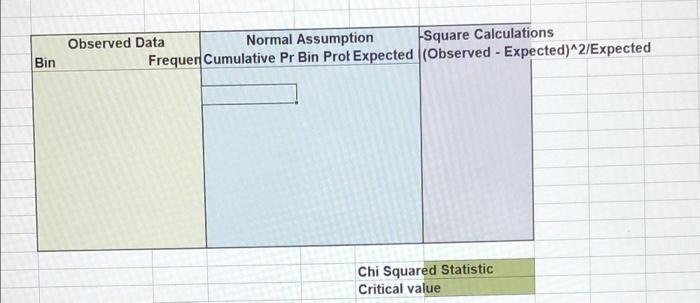
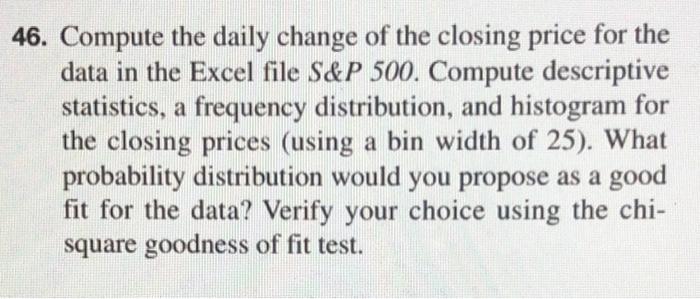
+ Mg Cong 1. || Co Sant 00 Sette All Te Wit Advanced Columns E- nata Tot Forecast Dar G H N 0 Daily Chango -&P 500 Data Daily late Open High Low Close Change 10/3/2007 1539.74 1545 B4 1536 34 1539 59 10/4/2007 1542.63 1544 02 1537.63 1542 84 3.25 10/5/2007 1550.51 1561.91 1543.84 1557.59 14.75 10/8/2007 1553.69 1556.51 1549.00 1552 58 -501 10/9/2007 1556.29 1565 27 1551.81 1565.15 12 57 10/10/2007 1561 65 1565.36 1555.46 1562 47 -2 68 10/11/2007 1570.07 1576 09 1548 72 1554 41 -8 06 10/12/2007 1556.50 1563 03 1554 09 1561 80 739 10/15/2007 1563 21 1564 74 1540.81 1548 71 13.09 10/16/2007 1545 85 1547 81 1536 29 1538 53 -10 18 10/17/2007 1553.14 1550 66 1526.01 1541 24 2.71 10/18/2007 1534.51 1542 79 1531.76 1540.08 -1.16 10/19/2007 1531.12 1540.00 1500 26 1500 63 -39.45 10/22/2007 1487 21 1508 06 1490.40 1506 33 5.70 10/23/2007 1515 65 1520.01 1503.61 1519.59 13.26 10/24/2007 1511.16 1517.23 1489 56 1515.88 -3.71 10/25/2007 1517.91 1523 24 1500.46 1514 40 -1.48 10/26/2007 1533.78 1535,53 1520 18 1535 28 20.88 10/29/2007 1540.11 1544 67 1536.43 1540.98 5.70 10/30/2007 1533,85 1539.42 1529 55 1531 02 -9.96 10/31/2007 1538.67 1552.76 1529 40 1549.38 18.36 11/1/2007 1531.61 1545 79 1506 66 1508 44 -40.94 11/2/2007 1513 66 1513.15 1492 53 1509.65 1.21 11/27 140 21 11 RALLARDO 150217 -7 AR 54 5 5 Mean Standard Error Median Mode Standard Deviation Sample Variance Kurtosis Skewness Range Minimum Maximum Sum Bin - 125 -100 -75 -50 -25 0 25 50 75 100 125 Bin -125 - 100 -75 -50 -25 0 25 50 75 100 125 More Frequency 0 1 4 10 82 581 741 58 9 1 1 0 Count Observed Data Normal Assumption Square Calculations Frequer Cumulative Pr Bin Prot Expected (Observed - Expected)^2/Expected Bin 5.46 Othe Type here to search 53 I Observed Data Normal Assumption Square Calculations Frequer Cumulative Pr Bin Prot Expected (Observed - Expected)^2/Expected Bin Chi Squared Statistic Critical value 46. Compute the daily change of the closing price for the data in the Excel file S&P 500. Compute descriptive statistics, a frequency distribution, and histogram for the closing prices (using a bin width of 25). What probability distribution would you propose as a good fit for the data? Verify your choice using the chi- square goodness of fit test. + Mg Cong 1. || Co Sant 00 Sette All Te Wit Advanced Columns E- nata Tot Forecast Dar G H N 0 Daily Chango -&P 500 Data Daily late Open High Low Close Change 10/3/2007 1539.74 1545 B4 1536 34 1539 59 10/4/2007 1542.63 1544 02 1537.63 1542 84 3.25 10/5/2007 1550.51 1561.91 1543.84 1557.59 14.75 10/8/2007 1553.69 1556.51 1549.00 1552 58 -501 10/9/2007 1556.29 1565 27 1551.81 1565.15 12 57 10/10/2007 1561 65 1565.36 1555.46 1562 47 -2 68 10/11/2007 1570.07 1576 09 1548 72 1554 41 -8 06 10/12/2007 1556.50 1563 03 1554 09 1561 80 739 10/15/2007 1563 21 1564 74 1540.81 1548 71 13.09 10/16/2007 1545 85 1547 81 1536 29 1538 53 -10 18 10/17/2007 1553.14 1550 66 1526.01 1541 24 2.71 10/18/2007 1534.51 1542 79 1531.76 1540.08 -1.16 10/19/2007 1531.12 1540.00 1500 26 1500 63 -39.45 10/22/2007 1487 21 1508 06 1490.40 1506 33 5.70 10/23/2007 1515 65 1520.01 1503.61 1519.59 13.26 10/24/2007 1511.16 1517.23 1489 56 1515.88 -3.71 10/25/2007 1517.91 1523 24 1500.46 1514 40 -1.48 10/26/2007 1533.78 1535,53 1520 18 1535 28 20.88 10/29/2007 1540.11 1544 67 1536.43 1540.98 5.70 10/30/2007 1533,85 1539.42 1529 55 1531 02 -9.96 10/31/2007 1538.67 1552.76 1529 40 1549.38 18.36 11/1/2007 1531.61 1545 79 1506 66 1508 44 -40.94 11/2/2007 1513 66 1513.15 1492 53 1509.65 1.21 11/27 140 21 11 RALLARDO 150217 -7 AR 54 5 5 Mean Standard Error Median Mode Standard Deviation Sample Variance Kurtosis Skewness Range Minimum Maximum Sum Bin - 125 -100 -75 -50 -25 0 25 50 75 100 125 Bin -125 - 100 -75 -50 -25 0 25 50 75 100 125 More Frequency 0 1 4 10 82 581 741 58 9 1 1 0 Count Observed Data Normal Assumption Square Calculations Frequer Cumulative Pr Bin Prot Expected (Observed - Expected)^2/Expected Bin 5.46 Othe Type here to search 53 I Observed Data Normal Assumption Square Calculations Frequer Cumulative Pr Bin Prot Expected (Observed - Expected)^2/Expected Bin Chi Squared Statistic Critical value 46. Compute the daily change of the closing price for the data in the Excel file S&P 500. Compute descriptive statistics, a frequency distribution, and histogram for the closing prices (using a bin width of 25). What probability distribution would you propose as a good fit for the data? Verify your choice using the chi- square goodness of fit test
Step by Step Solution
There are 3 Steps involved in it

Get step-by-step solutions from verified subject matter experts