

Question: Please help me solve this problem. I have included the data that's on the excel sheet. Question 30 0.5 pts Part 4: Input the upper
Please help me solve this problem. I have included the data that's on the excel sheet.
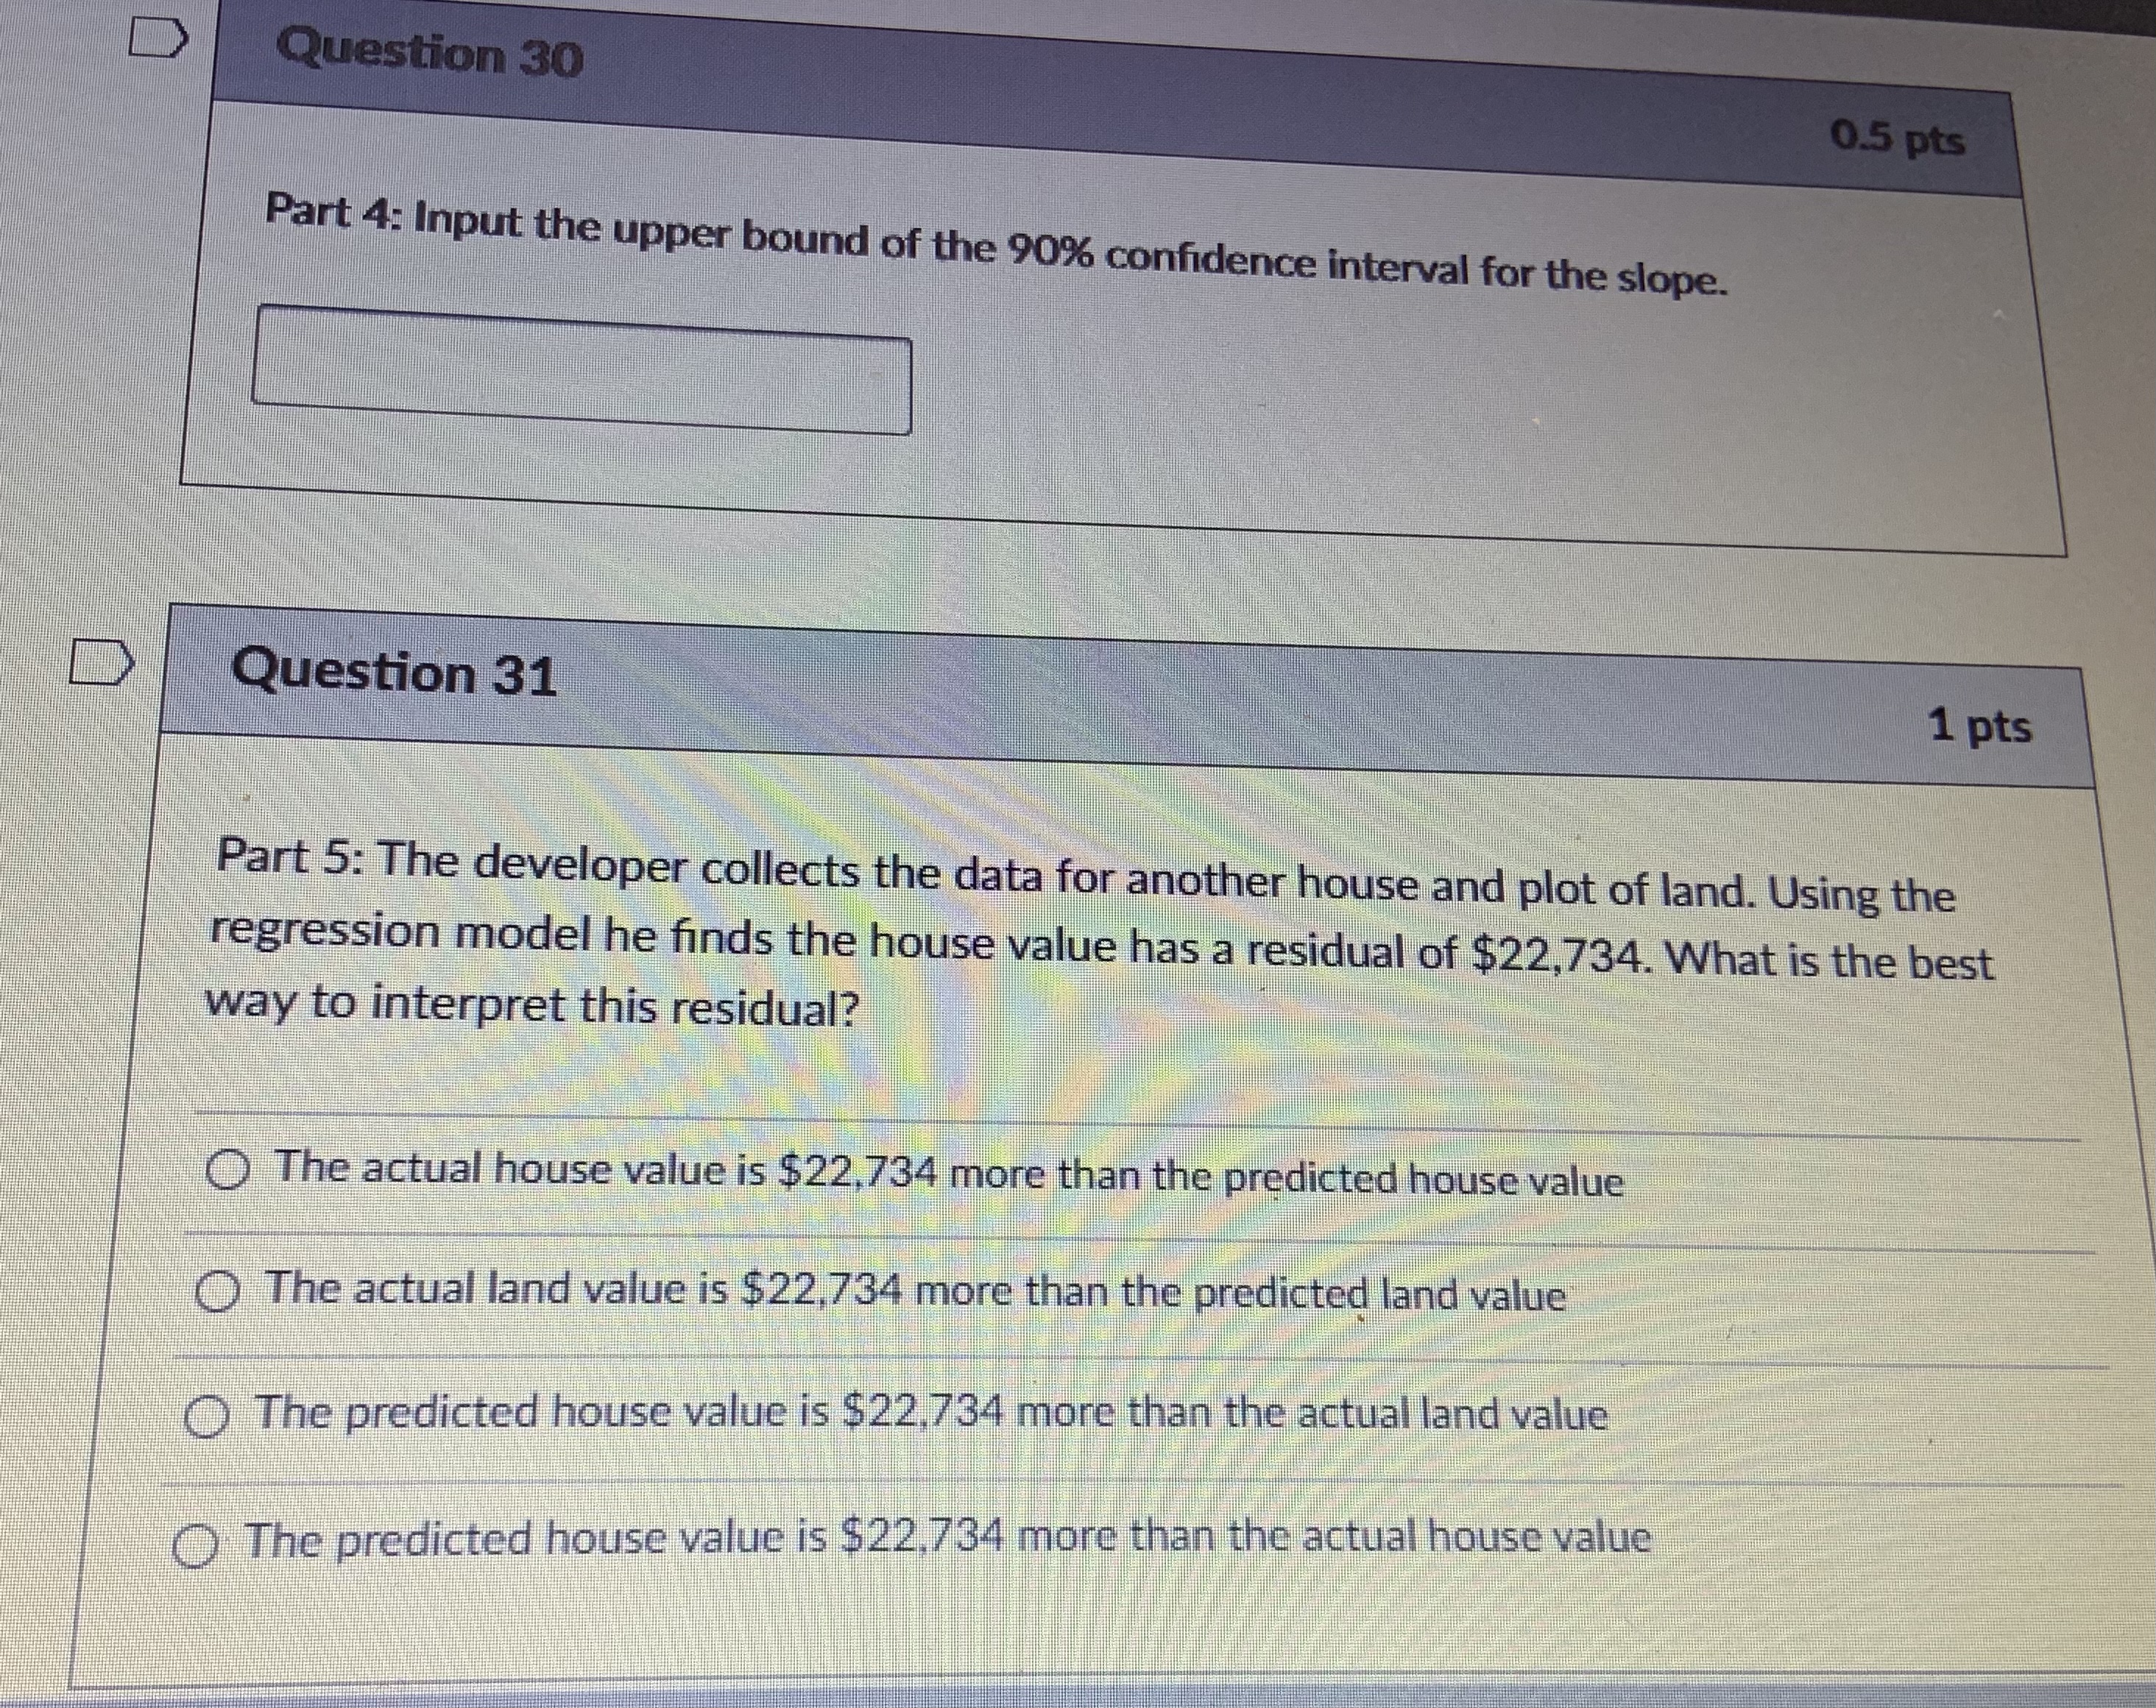
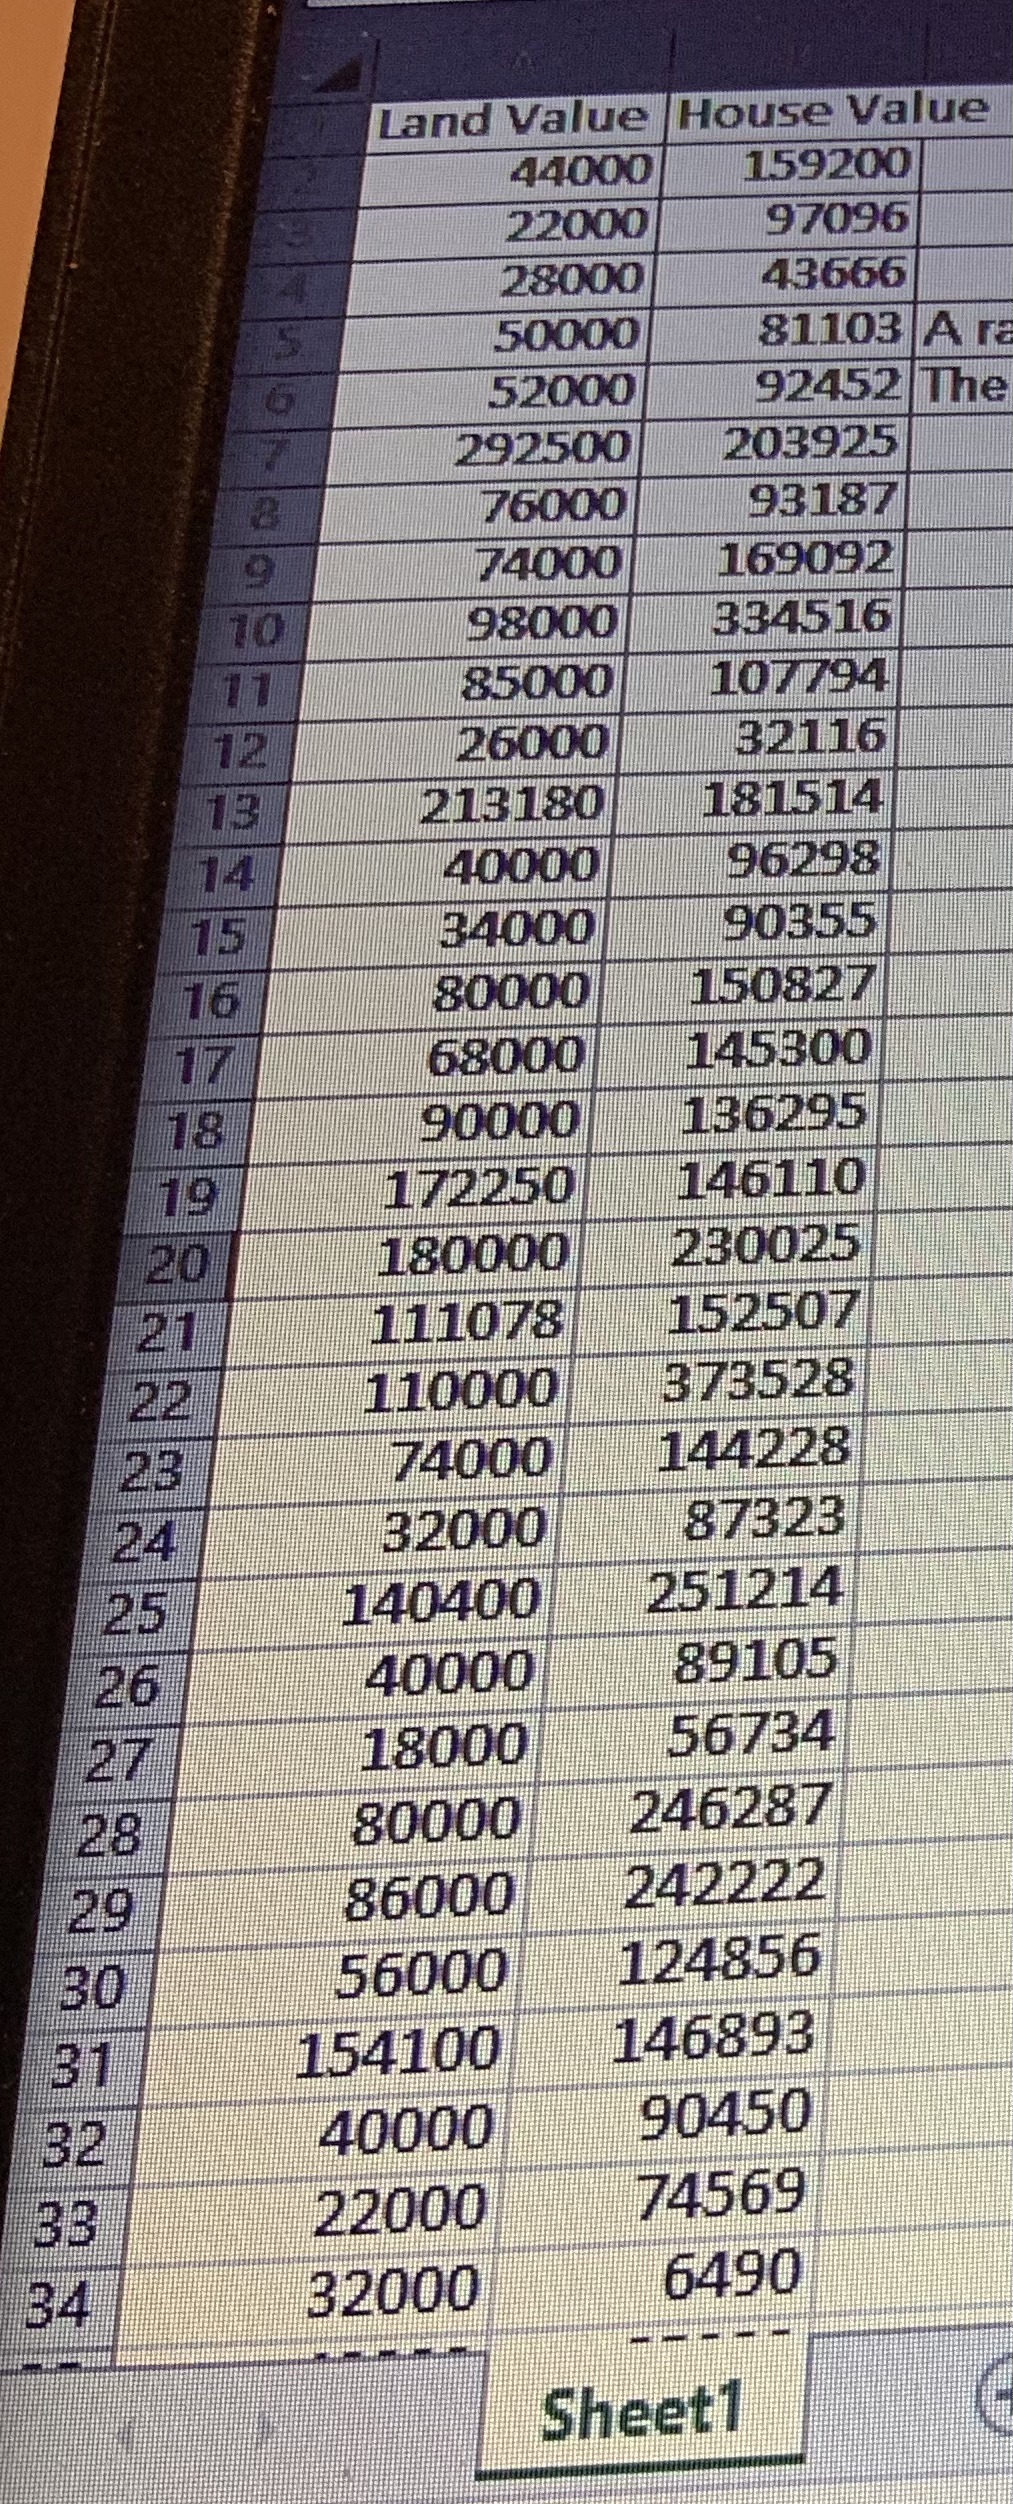
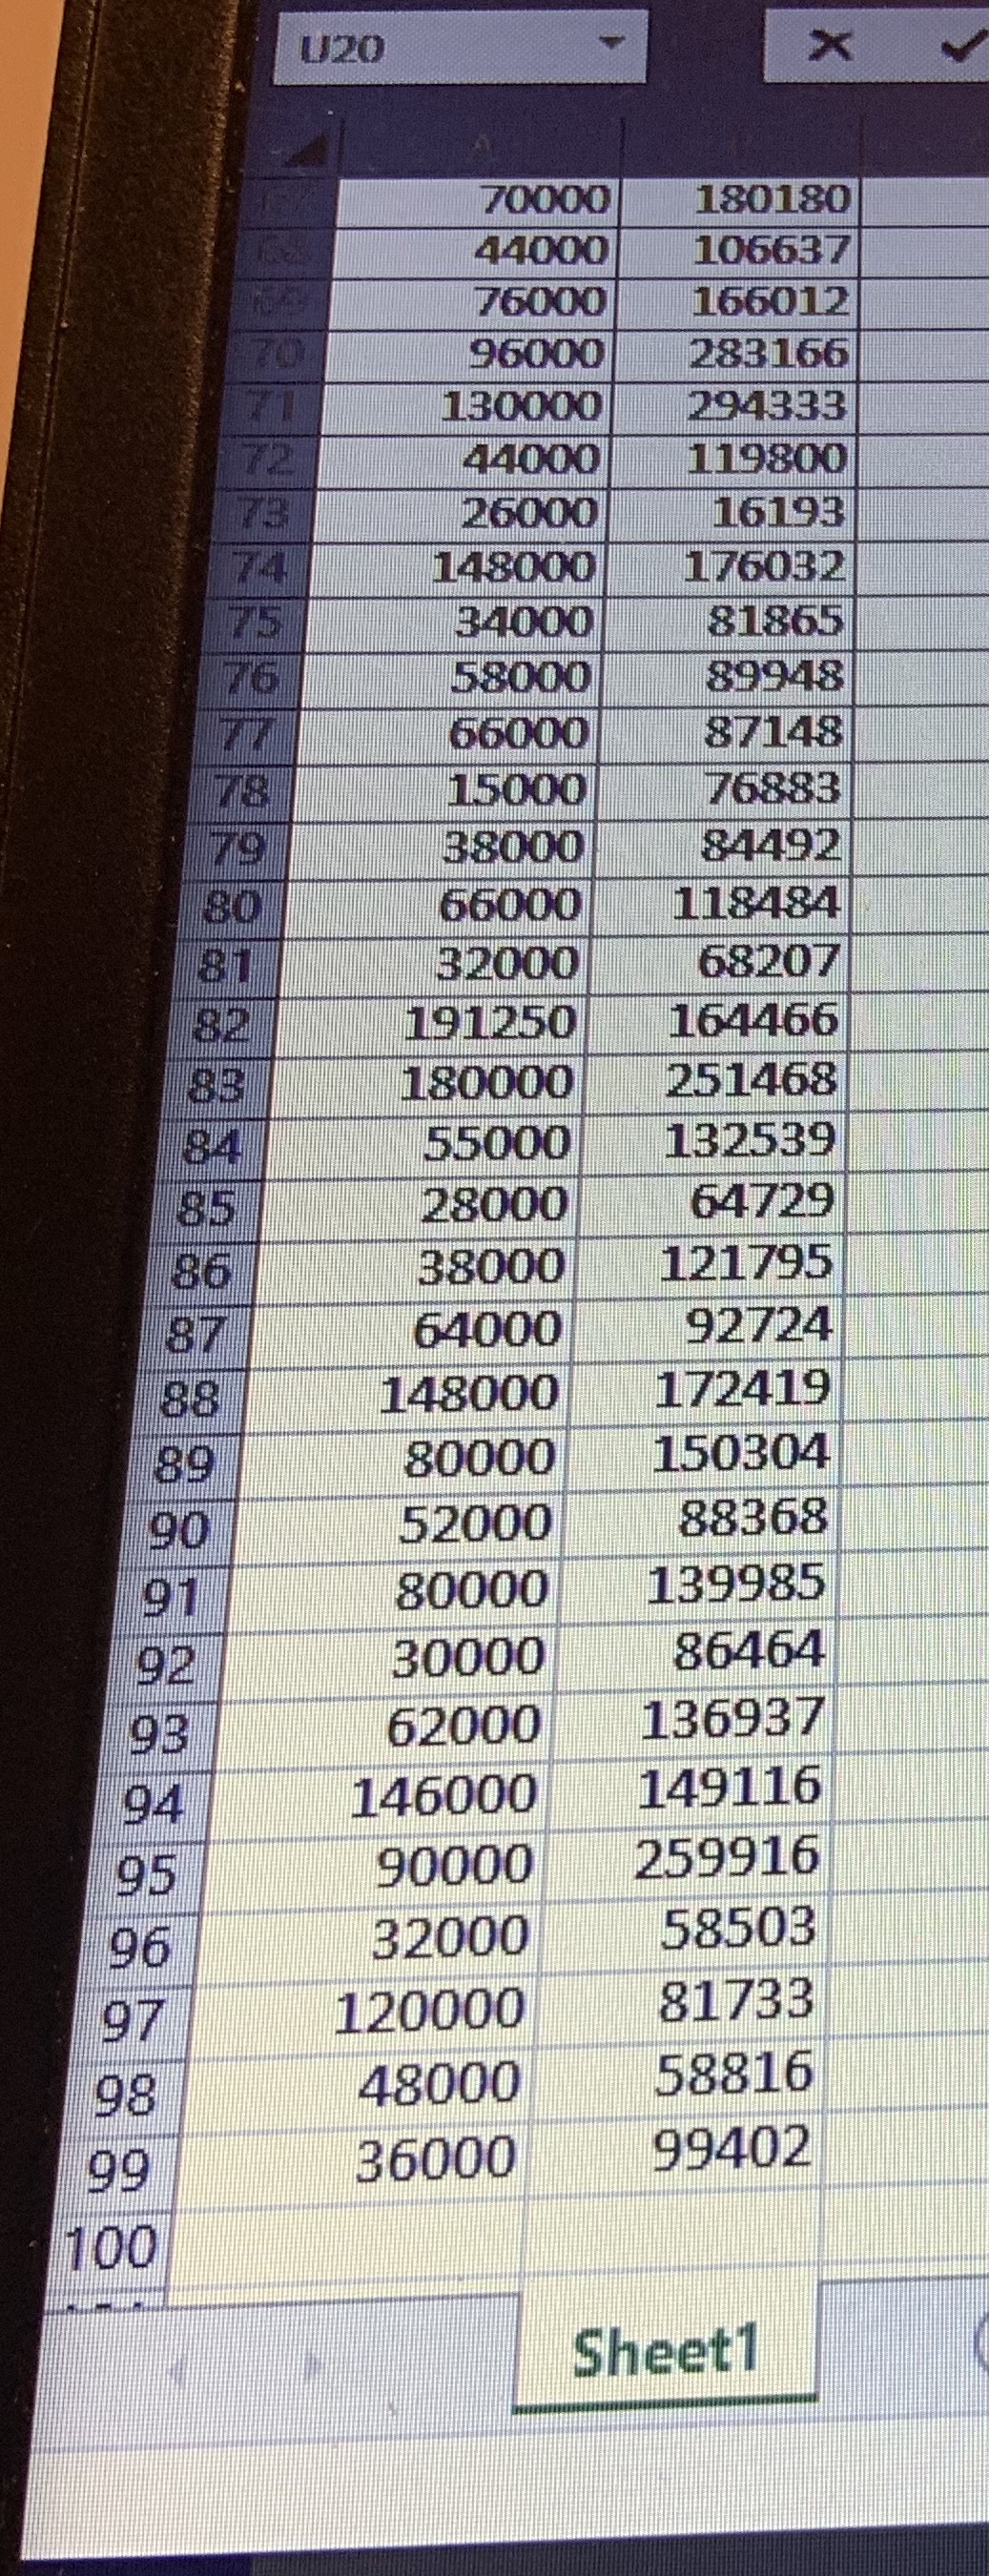
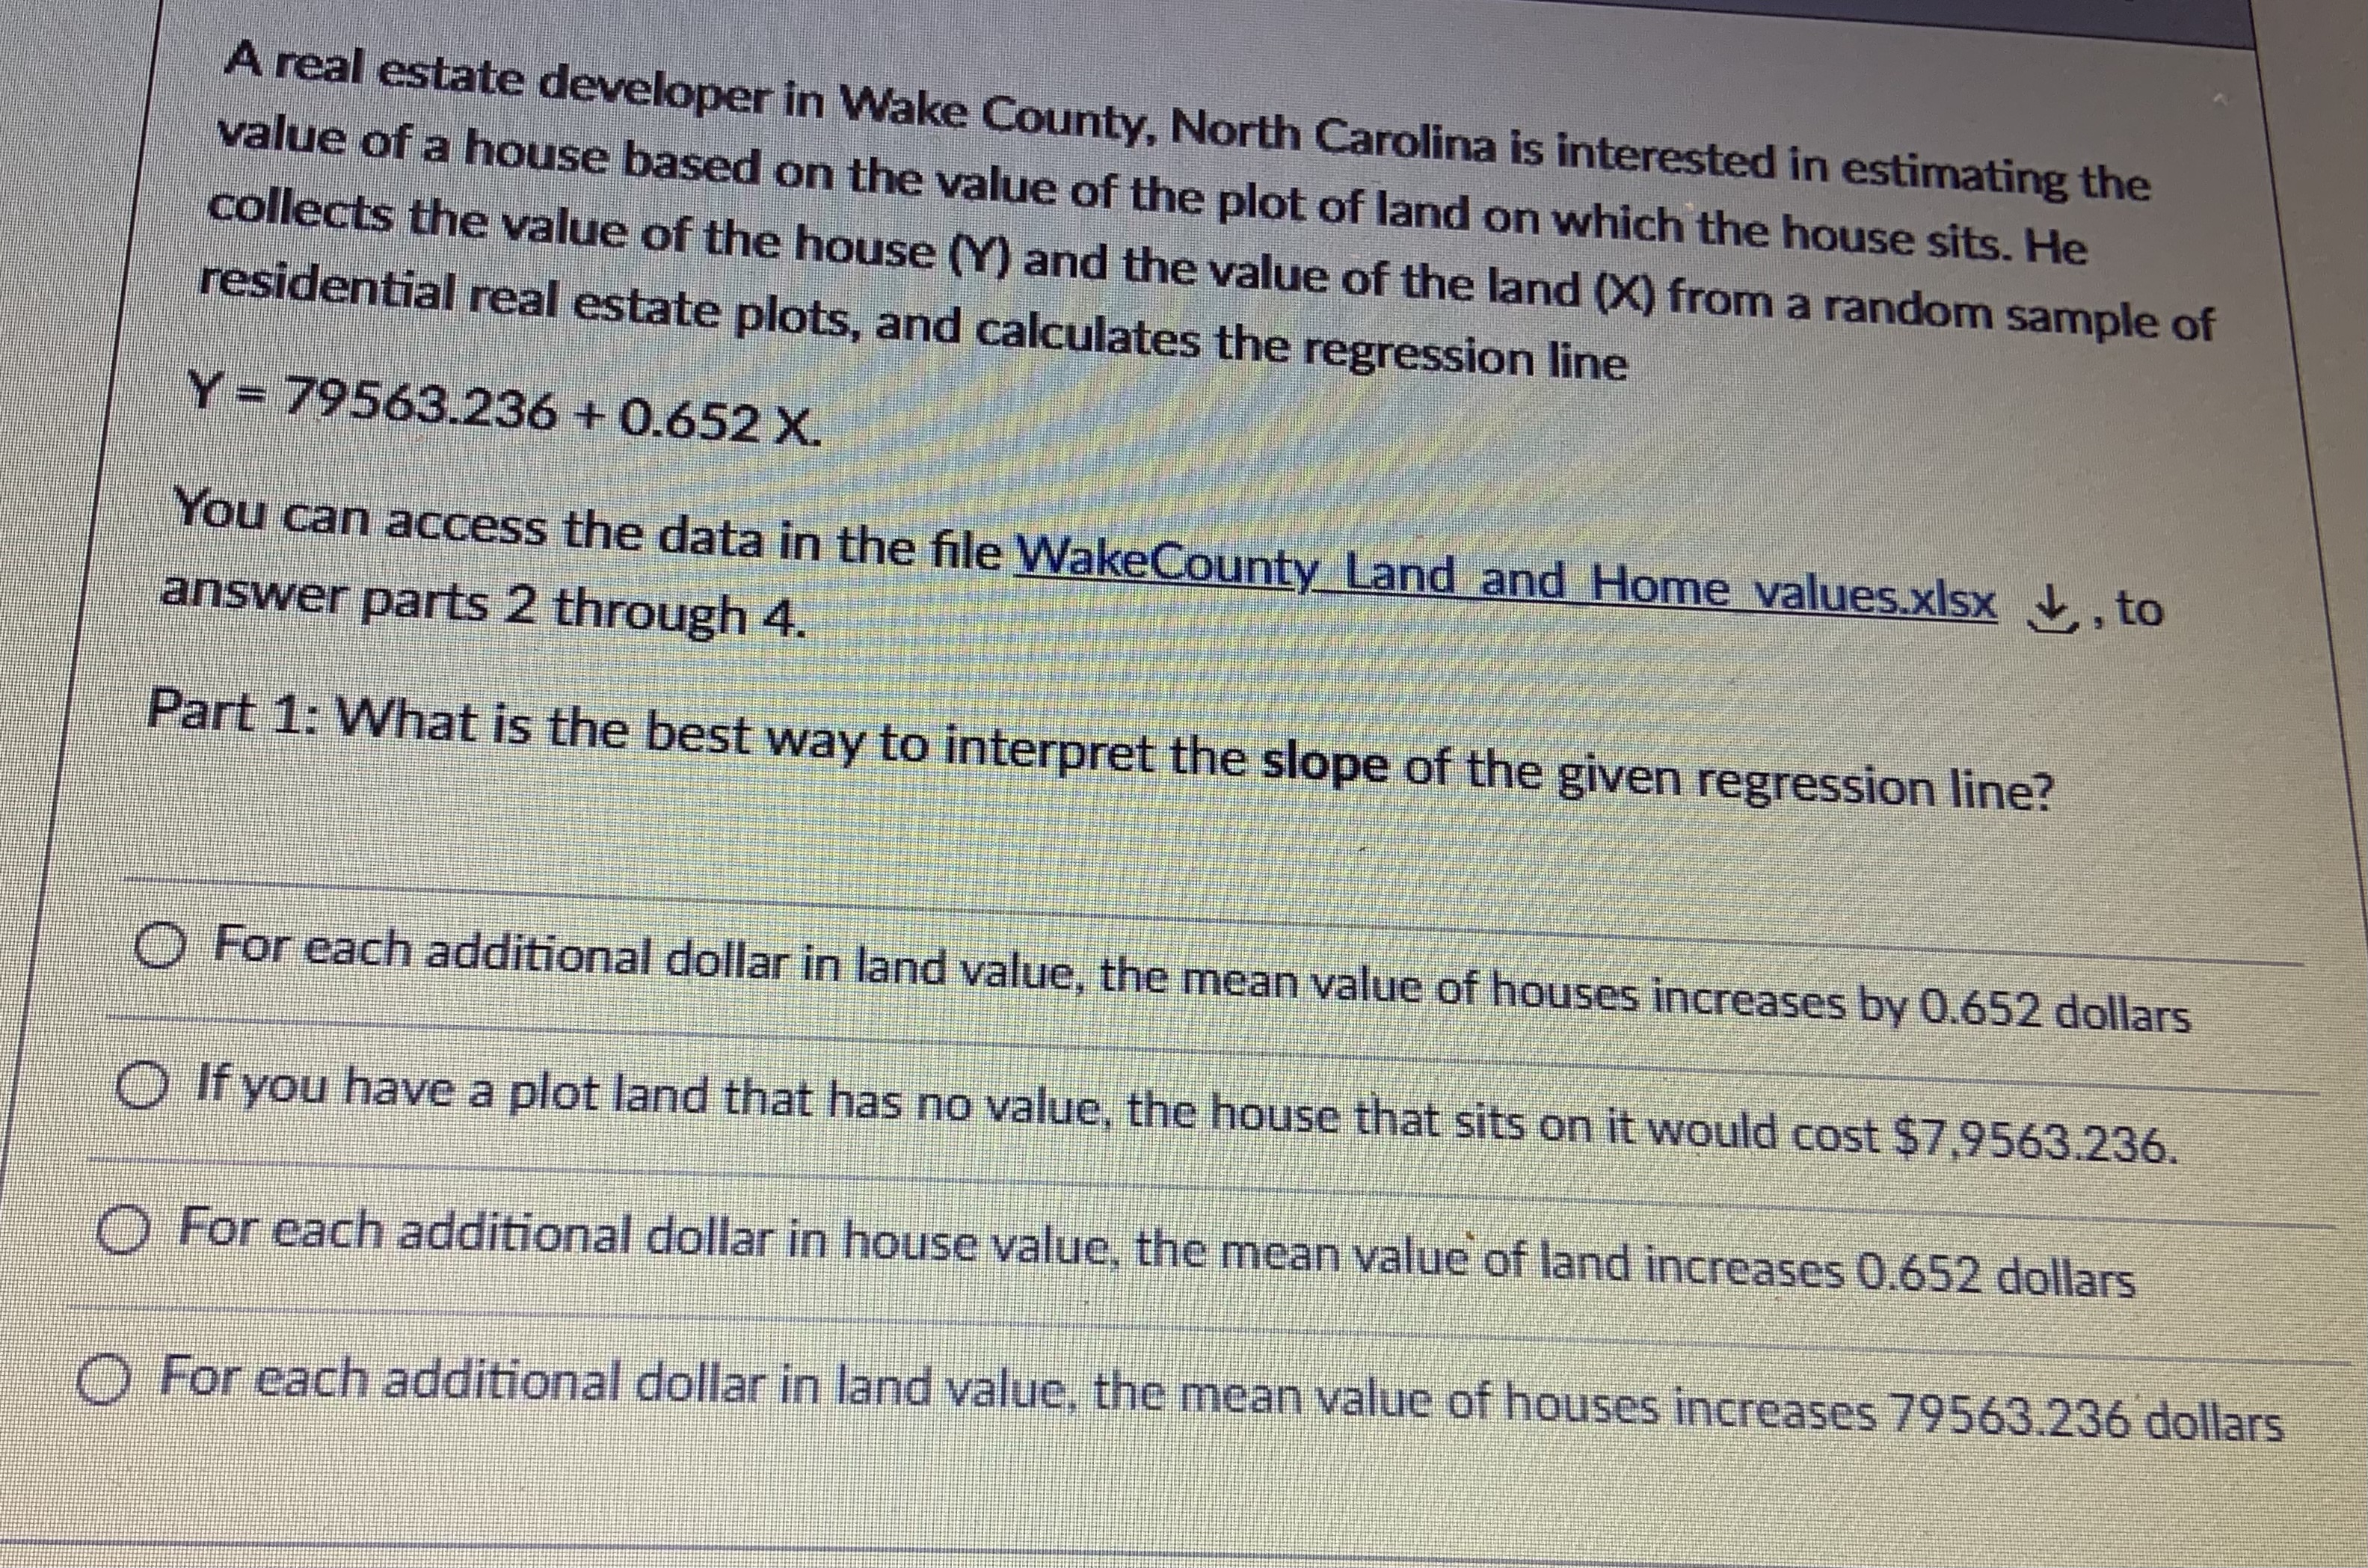
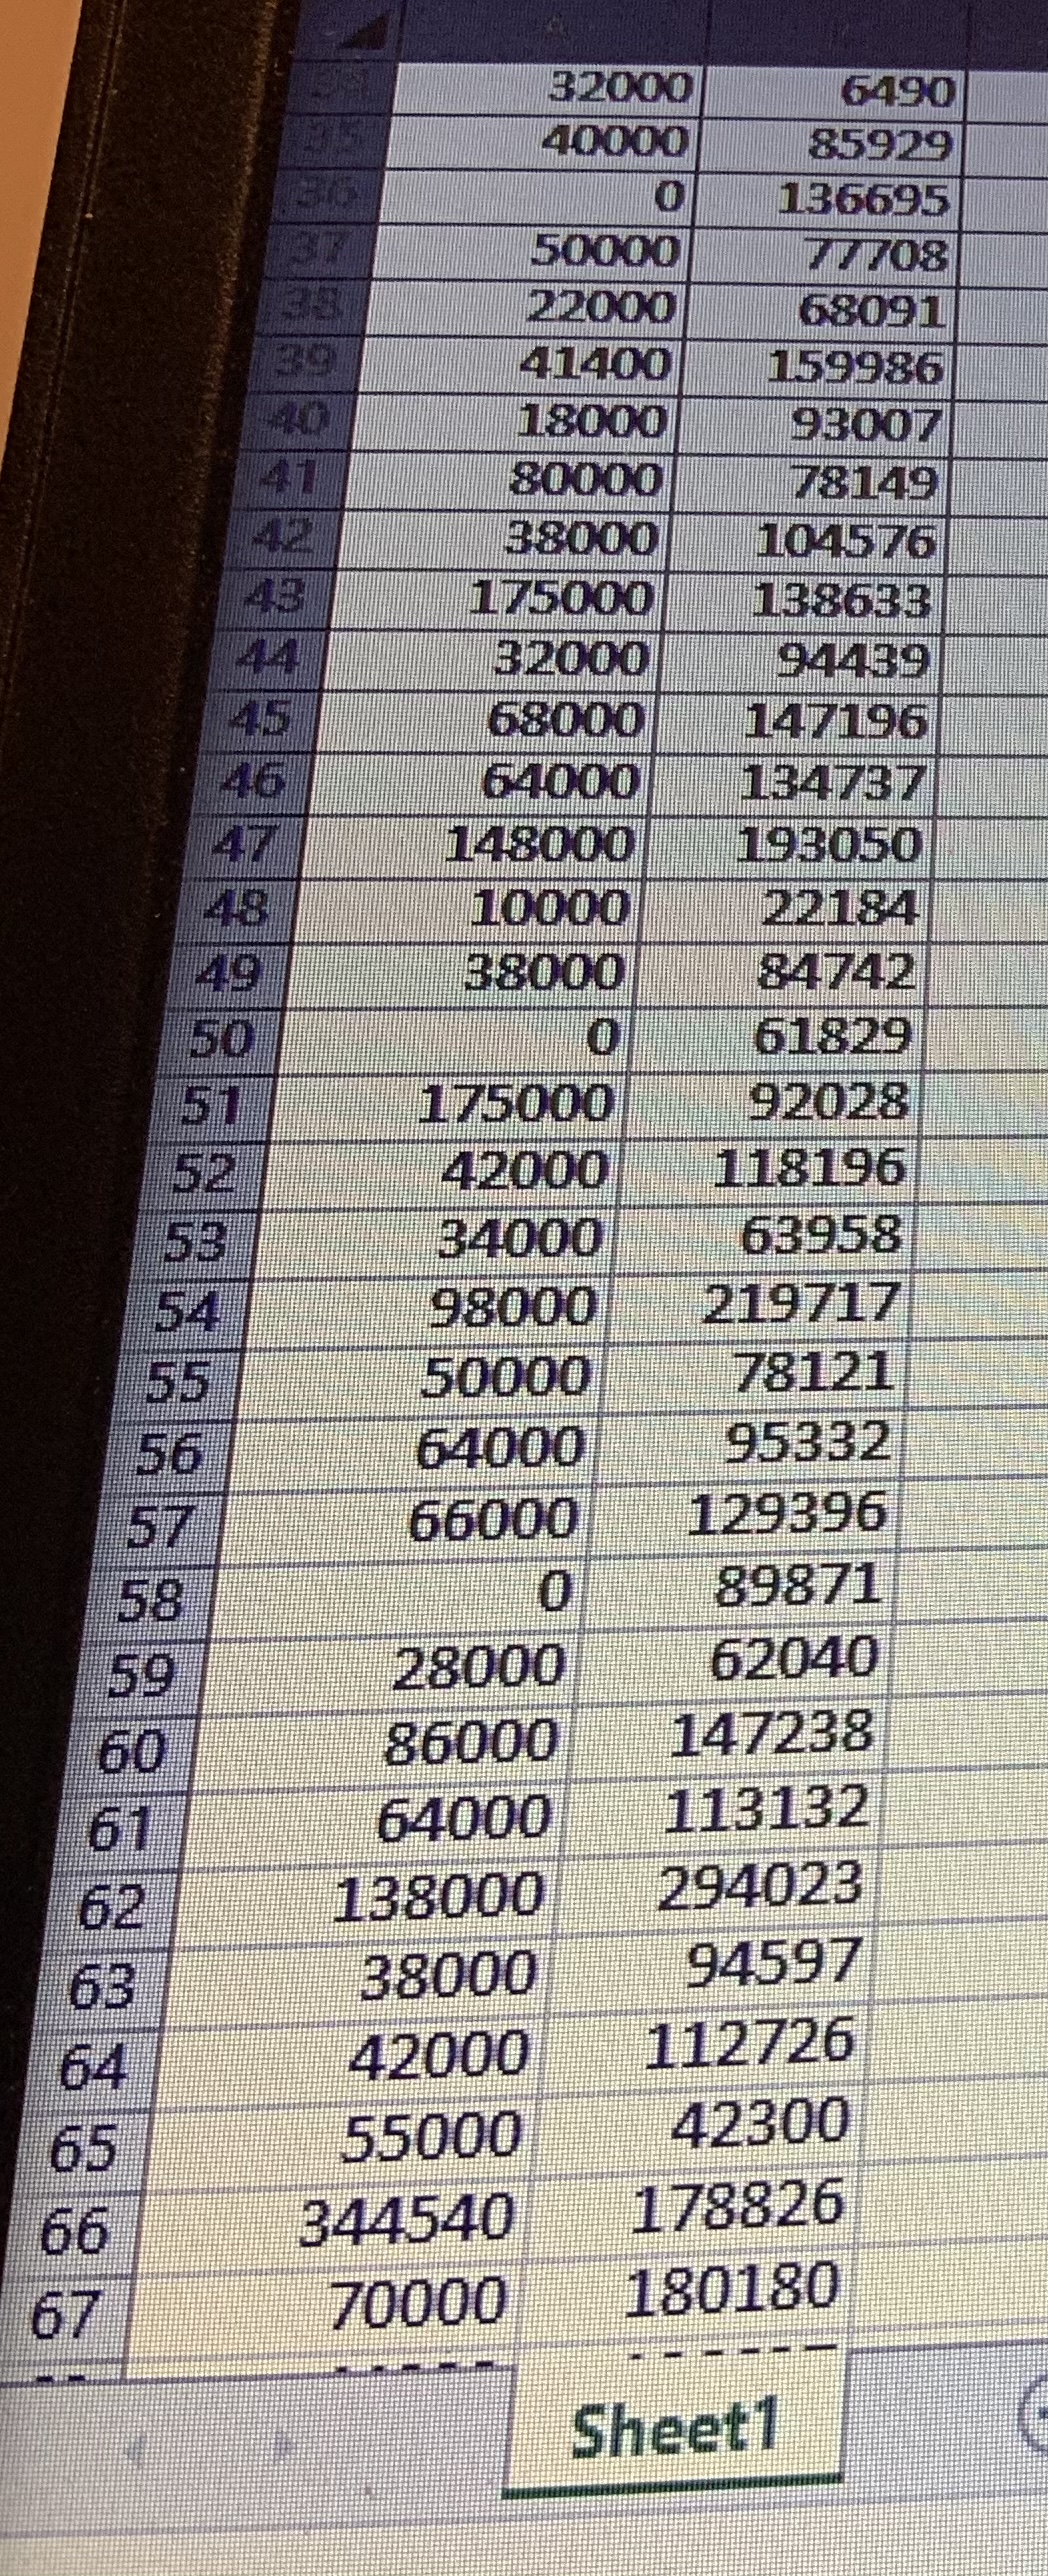
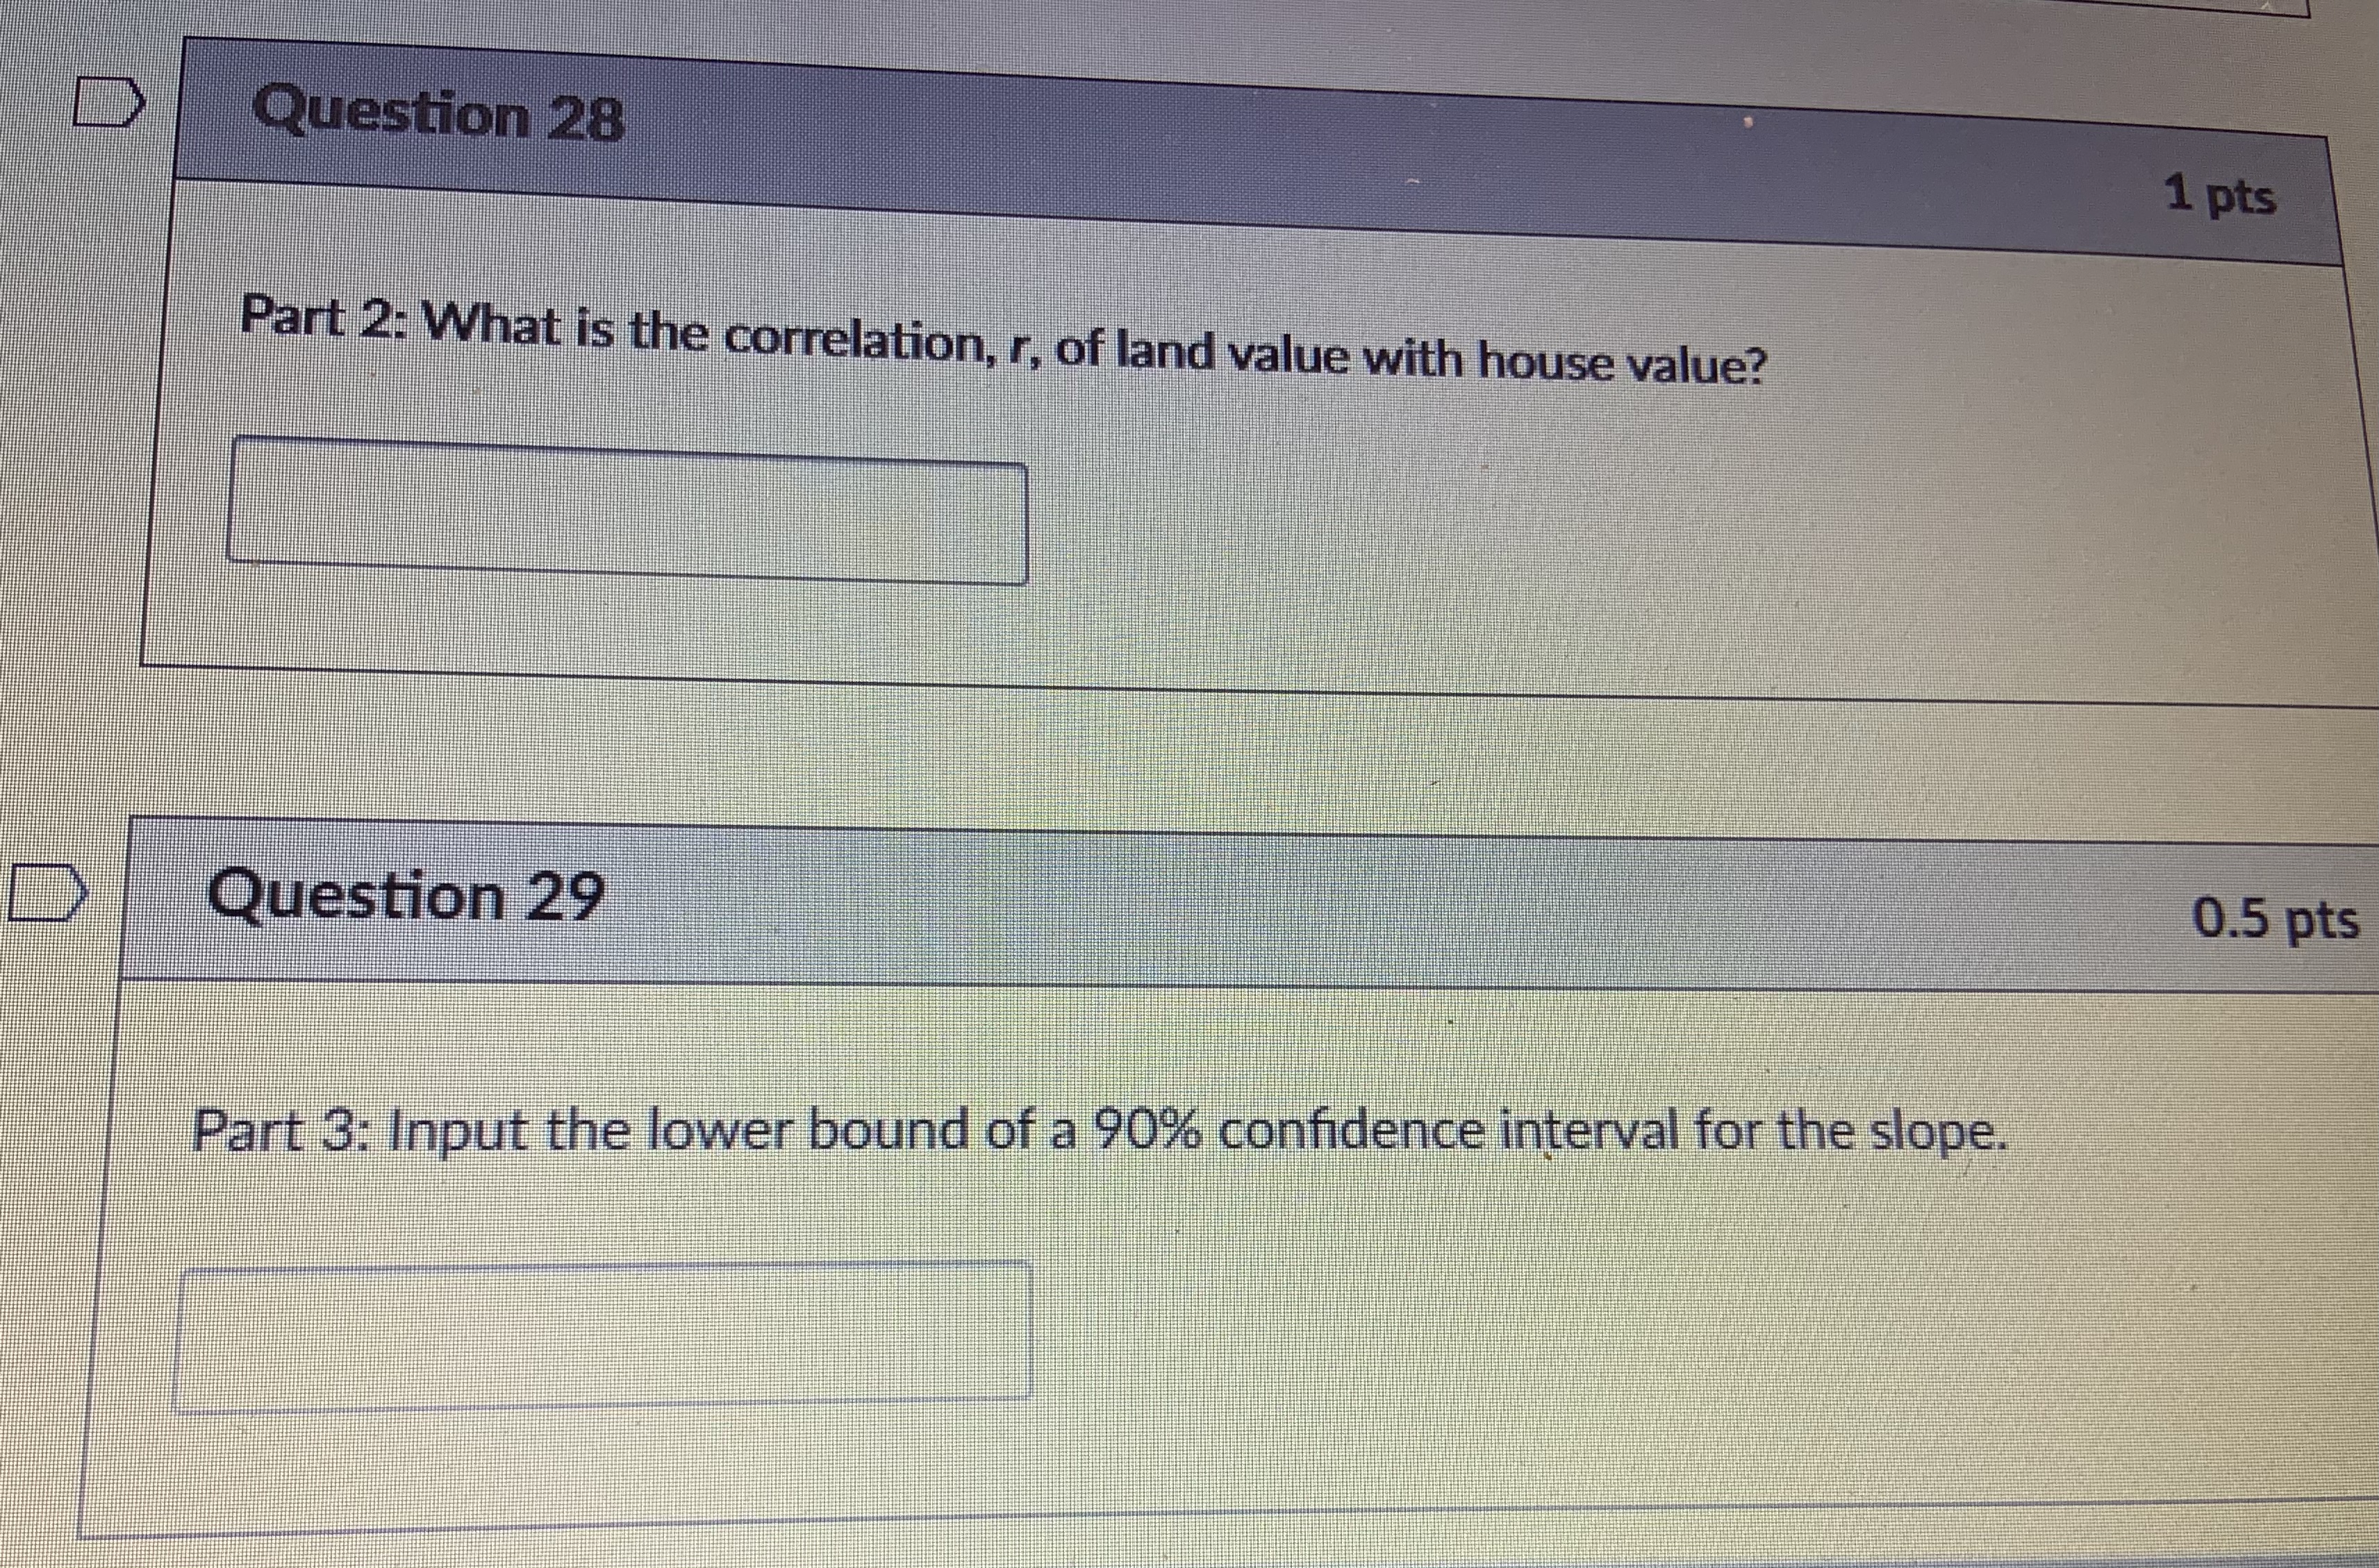
Question 30 0.5 pts Part 4: Input the upper bound of the 90% confidence interval for the slope. D Question 31 1 pts Part 5: The developer collects the data for another house and plot of land. Using the regression model he finds the house value has a residual of $22,734. What is the best way to interpret this residual? The actual house value is $22,734 more than the predicted house value The actual land value is $22,734 more than the predicted land value The predicted house value is $22.734 more than the actual land value The predicted house value is $22.734 more than the actual house value\fU20 70000 180180 44000 106637 76000 166012 70 96000 283166 130000 294333 72 44000 119800 73 26000 16193 74 148000 176032 75 34000 81865 58000 89948 66000 87148 15000 76883 38000 84492 80 66000 118484 81 32000 68207 82 191250 164466 83 180000 251468 84 55000 132539 85 28000 64729 86 38000 121795 87 64000 92724 88 148000 172419 89 80000 150304 90 52000 88368 91 80000 139985 92 30000 86464 93 62000 136937 94 146000 149116 95 90000 259916 96 32000 58503 97 120000 81733 98 48000 58816 99 36000 99402 100 Sheet1A real estate developer in Wake County, North Carolina is interested in estimating the value of a house based on the value of the plot of land on which the house sits. He collects the value of the house (Y) and the value of the land (X) from a random sample of residential real estate plots, and calculates the regression line Y - 79563.236 + 0.652 X. You can access the data in the file WakeCounty Land and Home values.xisx 4 , to answer parts 2 through 4. Part 1: What is the best way to interpret the slope of the given regression line? For each additional dollar in land value, the mean value of houses increases by 0.652 dollars If you have a plot land that has no value, the house that sits on it would cost $7,9563.236. For each additional dollar in house value, the mean value of land increases 0.652 dollars For each additional dollar in land value, the mean value of houses increases 79563.236 dollars32000 6490 40000 85929 136695 50000 77 708 22000 58091 41400 159986 18000 93007 41 80000 78149 42 38000 104576 175000 138633 44 3 2000 94439 45 68000 147196 46 64000 134737 47 148000 193050 48 10000 22184 49 38000 84742 50 O 61829 51 175000 92028 52 42000 118196 53 34000 63958 54 98000 219717 55 50000 78121 56 64000 95332 57 66000 129396 58 89871 59 28000 62040 60 86000 147238 61 64000 113132 62 138000 294023 63 38000 94597 64 42000 112726 65 55000 42300 66 344540 178826 67 70000 180180 Sheet1Question 28 1 pts Part 2: What is the correlation, r, of land value with house value? Question 29 0.5 pts Part 3: Input the lower bound of a 90% confidence interval for the slope
Step by Step Solution
There are 3 Steps involved in it

Get step-by-step solutions from verified subject matter experts