

Question: Please help me solve this problem using R or any other language you prefer. The data below shows the result of an experiment testing the
Please help me solve this problem using R or any other language you prefer.
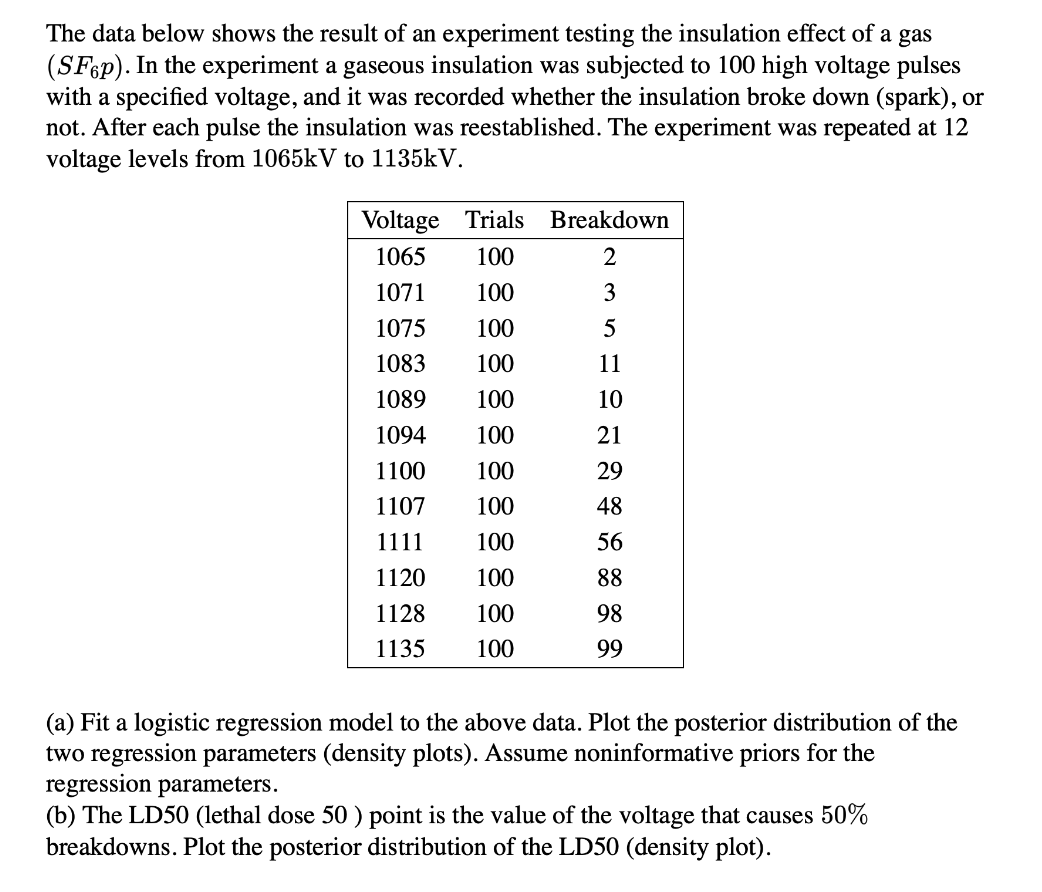
The data below shows the result of an experiment testing the insulation effect of a gas (SFp). In the experiment a gaseous insulation was subjected to 100 high voltage pulses with a specied voltage, and it was recorded whether the insulation broke down (spark), or not. After each pulse the insulation was reestablished. The experiment was repeated at 12 voltage levels from 1065kV to 1135kV. Voltage Trials Breakdown 1065 100 2 1071 100 3 1075 100 5 1083 100 11 1089 100 10 1094 100 21 1100 100 29 1107 100 48 1111 100 56 1120 100 88 1128 100 93 1135 100 99 (a) Fit a logistic regression model to the above data. Plot the posterior distribution of the two regression parameters (density plots). Assume noninformative priors for the regression parameters. (b) The LDSO (lethal dose 50 ) point is the value of the voltage that causes 50% breakdowns. Plot the posterior distribution of the LDSO (density plot)
Step by Step Solution
There are 3 Steps involved in it

Get step-by-step solutions from verified subject matter experts